

Table of Contents
| KEY TAKEAWAYS Urban heat refuge networks in most cities fail across 3 equity axes: geographic proximity, temporal availability, and mobility-inclusive access design. Barcelona’s climate shelter model — 409 nodes targeting a 5-minute walk for all residents by 2030 — remains the only municipally institutionalized refuge network in Europe. The resilience gap in urban heat response is not technical. It is political, structural, and equity-blind. Singapore’s cool corridor pilot demonstrates how passive design, data-linked activation, and transit integration convert existing infrastructure into a 24-hour thermal safety net. By 2030, cities without a network resilience index for heat shelters risk non-compliance with emerging EU Urban Resilience Directives and WHO heat health frameworks. |
The City Is Burning. And You Built It This Way.
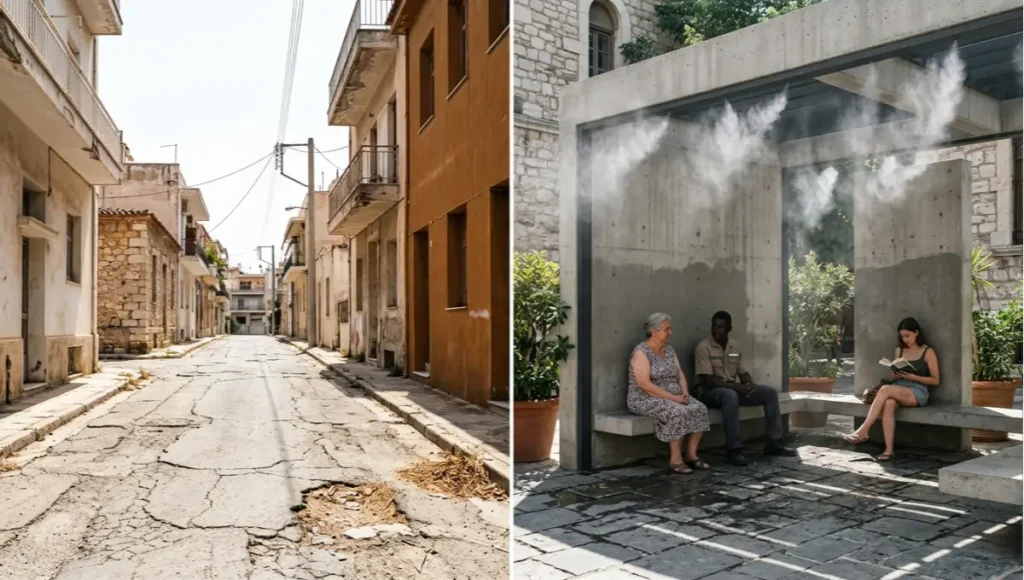
Urban heat refuge networks are not a design amenity. They are emergency infrastructure — and the cities you inhabit have, with rare exception, failed to build them equitably, intelligently, or at scale. This is not an oversight. It is a systemic choice embedded in decades of zoning policy, budget allocation, and the quiet prioritization of real estate value over human survivability.

You are living through the urban century’s most predictable crisis. Heat kills more people annually than floods, storms, and wildfires combined in many high-income nations — yet the thermal safety architecture of most cities was designed for a climate that no longer exists. Cooling centers get opened reactively, announced through press releases during a heat emergency, and closed the moment temperatures drop. That is not a network. That is triage.
The distinction matters. Urban heat refuge networks — as a systemic, spatially distributed, equity-calibrated layer of urban resilience infrastructure — represent a fundamentally different proposition. They require permanence, proximity logic, multi-typology design, 24-hour availability protocols, and governance architecture that outlasts any single administration. What most cities have built instead are three critical equity gaps that this analysis will name, quantify, and dismantle.
At Nuvira Space, the City Is a Thermal System First
At Nuvira Space, we do not accept the premise that urban heat is a natural phenomenon. It is an engineered condition — produced by the cumulative decisions of planners, developers, and politicians who optimized for density without accounting for thermal consequence. The recalibration of the metropolitan fabric through data-driven design begins with acknowledging that every surface, every canyon of glass and asphalt, every treeless arterial road is a design output with a thermal signature.
Our work at the intersection of human-machine synthesis positions us to see what conventional urban planning cannot: the heat-equity gap is not random. It is spatial, demographic, and predictable.
When you map urban heat islands against income distribution, transit access, and the density of existing cooling infrastructure, the inequity resolves into a pattern that is both damning and actionable. Cities do not need more cooling centers. They need thermal resilience networks designed with the same systemic rigor applied to water, power, and mobility infrastructure — and they need those networks calibrated to reach the residents least able to survive without them.
The Blueprint: What a Real Urban Heat Refuge Network Looks Like
Before you can close the 3 equity gaps, you need to understand what a functional urban heat refuge network actually constitutes. Not as a policy document aspiration, but as a designed urban system with measurable spatial, temporal, and social performance criteria.
The 5-Typology Framework
A resilient network operates across five distinct refuge typologies, each serving a different population segment and thermal function:
- Type 1 — Passive Green Corridors: Street-level tree canopy achieving minimum 40% shade coverage along arterial pedestrian routes, calibrated to reduce ambient air temperature by 2–4°C at street level. For complementary surface strategies, cool pavement technology represents a scalable parallel intervention — see Nuvira’s analysis of cool pavement and urban heat island mitigation.
- Type 1 supplement — Cool Pavement Integration: albedo-engineered pavement surfaces reduce surface temperature by 10–15°C relative to standard asphalt. Read Nuvira’s deep-dive: Cool Pavement and the Urban Heat Island
- Type 2 — Activated Public Buildings: Libraries, civic centers, and transit hubs operating as climate refuges during heat alerts, with extended hours to 22:00 and designated cool zones with seating capacity metrics (min. 1 seat per 200 residents in a 500m catchment).
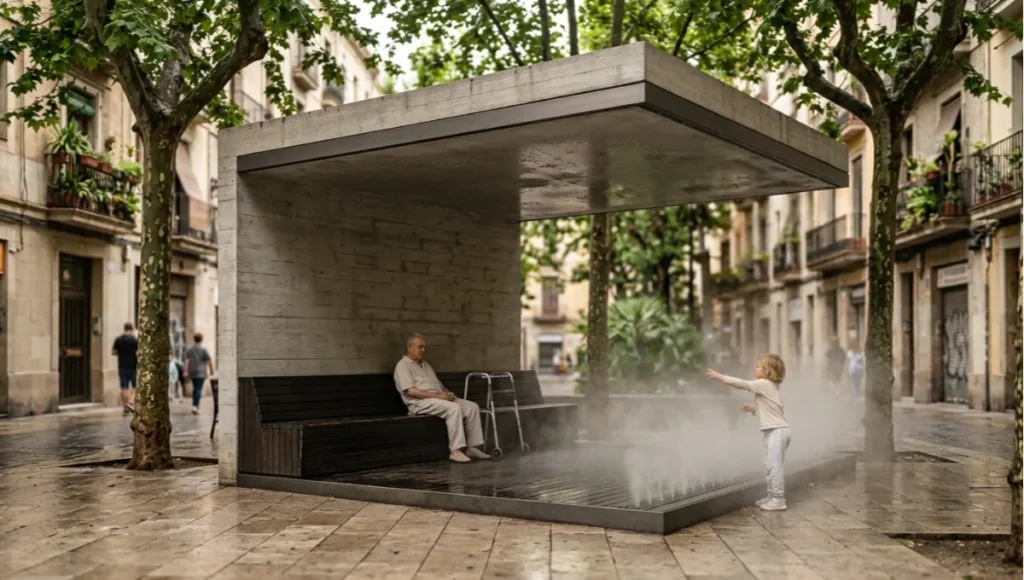
- Type 3 — Purpose-Built Cool Nodes: Free-standing climate infrastructure — misted pavilions, thermally insulated rest pods, solar-powered cool shelters — deployed at high-exposure locations including transit stops, open markets, and park peripheries.
- Type 4 — Water Infrastructure Integration: Activated fountains, splash zones, and misted pedestrian corridors connected to grey-water recycling systems and triggered by real-time heat index data.
- Type 5 — Residential Adjacency Points: Cool rooms embedded in social housing complexes and community centers, prioritizing buildings without mechanical cooling and occupied by elderly and low-income residents.
Spatial Performance Standards
Proximity Threshold Specifications
- Maximum 400m walk distance to a Type 1–3 refuge from any residential address
- Maximum 300m walk distance in districts classified as Urban Heat Island Severity Level 3 or above
- Network node density: minimum 1 refuge per 4 hectares in high-risk census tracts
- Coverage audit: annual GIS-based accessibility mapping against demographic vulnerability indices
The 3 Equity Gaps Cities Are Failing to Close
Here is the critical analysis you need to hear. The urban heat refuge networks that exist in most cities — and there are very few of them — systematically fail along three axes. These are not incidental weaknesses. They are the predictable outputs of planning systems that have not been designed with equity as a load-bearing variable.
Equity Gap 1: Geographic Proximity Failure
The first gap is spatial. In city after city, the distribution of existing cooling infrastructure correlates inversely with heat exposure risk. Wealthy, tree-lined neighborhoods with high building albedo, lower pavement density, and access to private air conditioning are also the areas with the highest concentration of libraries, community centers, and public parks that could serve as refuges. The neighborhoods with the highest urban heat island intensity — low-income, high-impervious-surface, transit-adjacent — have the fewest accessible refuge nodes.
In Richmond, Virginia, research published in Environmental Health Perspectives demonstrated a direct statistical correlation between the location of heat-related illness emergency callouts and the distance to the nearest available cooling facility. The gap is not measured in kilometers — it is measured in minutes, mobility constraints, and fatalities.
- Documented proximity failure: 60–70% of heat-related EMS calls in Richmond occurred in districts more than 800m from the nearest cooling center
- Comparative deficit: low-income census tracts show 3.2x fewer accessible refuge nodes than high-income tracts in equivalent-sized US cities
- Design response required: mandatory proximity scoring in planning approvals for any development in UHI Severity Level 2+ zones
Equity Gap 2: Temporal Availability Collapse
The second gap is chronological. The urban heat emergency does not operate on government office hours — but most refuge infrastructure does. Libraries close at 18:00. Civic centers lock at 17:30. The temperature peak in many urban environments occurs between 14:00 and 20:00, and the overnight low in dense urban cores remains 5–8°C above suburban or rural equivalents — a condition climatologists call the urban heat island nocturnal retention effect.
For elderly residents in non-air-conditioned housing, it is the overnight period that kills. Core body temperature regulation fails during sleep in sustained ambient temperatures above 26°C without mechanical cooling. A refuge network that closes at 18:00 addresses the politics of heat without addressing the physiology.
- Critical operating hours: 06:00–24:00 minimum; 24-hour access required in Severity Level 3 UHI zones
- Greenpeace audit finding (16 Spanish cities): over 40% of registered climate shelters had insufficient evening hours during documented heat events
- Monitoring requirement: refuge utilization sensors (IR occupancy counters + temperature logging) to validate actual activation and occupancy during alert periods
Equity Gap 3: Mobility-Inclusive Access Design Absence
The third gap is infrastructural and social. Urban heat refuge networks are only functional if the populations most at risk can physically reach and use them. The residents most vulnerable to heat mortality — those over 70, those with mobility impairments, those experiencing homelessness, those without private vehicle access — face the greatest structural barriers to accessing the cooling infrastructure that does exist. This equity deficit mirrors broader failures in inclusive public space design — a field Nuvira has examined extensively in the context of park and open space planning.
Barriers are not only physical. Language, documentation requirements, social stigma, and the absence of multilingual communication about available refuges constitute equity gaps that no amount of additional infrastructure resolves without intentional inclusion design.
- Accessibility standards required: all Type 2 and 5 nodes must meet or exceed EN 17210 accessibility requirements
- Communication equity: heat alert messaging in minimum 4 languages in districts with >15% non-native language population
- Outreach integration: refuge networks must be formally connected to social services, housing support, and community health worker systems
- Wayfinding: thermal comfort signage within 100m of every refuge node, with visual contrast standards for visually impaired users
Feasibility Study: The Economic and Political Barriers
The Economic Calculus Cities Keep Getting Wrong
The argument against investing in urban heat refuge networks at scale is almost always economic. Municipalities operating under chronic fiscal constraints weigh the capital expenditure of a distributed cooling infrastructure network against competing priorities — housing, transit, stormwater — and the network loses. This cost calculus is structurally flawed in ways that compound the equity problem.
The economic cost of heat mortality and heat-related morbidity is rarely factored into the comparison. The WHO Heat Health Action Plan — the primary international framework for urban heat emergency governance — explicitly identifies the failure to account for downstream health system costs as the central fiscal error in municipal heat adaptation planning. In the US alone, the National Bureau of Economic Research has estimated that a 1°C increase in average summer temperatures is associated with a 2.5% increase in total mortality.
- Estimated cost of a Type 3 purpose-built cool node: USD 45,000–120,000 depending on specification and site conditions
- Annual operating cost of a 50-node urban network (Type 1–3 combined): approximately USD 1.2–2.8M per city
- Comparative cost: a single heat-related hospital admission averages USD 22,000 in direct medical costs in the US; a network preventing 60 such admissions annually is net-positive in Year 1
- EU funding pathway: Urban Resilience Facility under the 2021–2027 Cohesion Policy framework includes eligible expenditure for urban heat adaptation infrastructure
The Political Architecture of Inertia
Beyond economics, the political barrier to urban heat refuge networks is structural. Heat adaptation is cross-departmental — it requires coordination between urban planning, public health, transport, parks, and social services. In most municipal governance architectures, those departments do not share budgets, KPIs, or planning cycles. The result is that accountability for building and maintaining a refuge network falls into the gap between silos.
Political will is further undermined by the episodic nature of heat emergencies. Unlike flooding — which produces visible, media-persistent damage to property — heat mortality is largely invisible. It happens indoors, among the elderly and socially isolated. It does not generate the political urgency that images of flooded streets produce. This invisibility is itself an equity problem: the populations most likely to die from heat are also the least politically visible.
Proof of Concept: Singapore’s Cool Corridor Pilot
Singapore presents the most instructive case study available for data-integrated urban heat refuge network design. In a city-state with consistently high ambient temperatures — averaging 31°C in peak months with humidity regularly above 85% — the thermal resilience of public space is not a climate adaptation aspiration. It is a foundational urban design requirement. Peer-reviewed comparative analysis of refuge network governance, including Singapore and European models, is documented in Urban Climate Refuge Networks: A SWOT–CAME Framework Analysis (MDPI Urban Science, 2026).
The Housing Development Board’s Cool Corridor pilot, first deployed in the Tengah district and subsequently expanded across multiple new town developments, represents the first municipal attempt to operationalize a thermally calibrated pedestrian network as permanent infrastructure rather than event-triggered response.
Technical Parameters of the Singapore Cool Corridor Model
- Corridor design temperature target: ambient air temperature at pedestrian height maintained below 31°C during peak hours through passive and active interventions
- Canopy integration: minimum 70% shade coverage of all covered walkways connecting residential blocks to MRT stations and commercial nodes
- Misting system activation: IoT-linked trigger at wet-bulb globe temperature (WBGT) above 32°C, with water recovered from condensate collection systems
- Cool node density: 1 activated cool zone per 150 residents in high-exposure HDB precincts
- 24-hour operation: all covered linkways maintained as passive refuges; activated misting available 06:00–23:00
- Data integration: temperature sensors networked to the Smart Nation Sensor Platform, enabling real-time performance monitoring and predictive deployment during heat advisories
What Singapore demonstrates is not that the problem is easy — the city-state’s governance model and fiscal capacity are exceptional. What it demonstrates is the design logic: thermal resilience requires network thinking, data activation, and infrastructure permanence. This systems-level approach parallels the logic of sponge city infrastructure design — another distributed urban resilience framework that converts passive urban assets into active environmental performance systems.
The transferable lesson is about methodology, not budget. You do not need Singapore’s fiscal resources to implement proximity logic, temporal availability standards, and mobility-inclusive access design. You need a governance commitment to treat heat as infrastructure — and the political architecture to enforce that commitment across departmental boundaries.
| ⚠ Speculative / Internal Concept Study — Project THERMA GRID by Nuvira Space. This concept does not represent a completed or commissioned project. All design parameters are theoretical. |
Concept Project Spotlight: Project THERMA GRID by Nuvira Space
Speculative / Internal Concept Study — This project does not represent a completed or commissioned design.
Corridor Typology
A functioning network draws on four distinct corridor types, each solving a different piece of the urban heat problem.
- Wind corridors: building setbacks and street orientations calibrated to prevailing breeze direction, clearing a path for air to move rather than stagnate between towers.
- Canopy corridors: continuous tree cover along pedestrian routes, prioritizing species with dense, low-branching crowns over ornamental single specimens.
- Blue corridors: retained or restored waterways, permeable pavement, and bioswales that use evaporative cooling as a working mechanical process, not a water feature.
- Material corridors: high-albedo and permeable surfacing on the specific streets that carry the most midday pedestrian volume, rather than blanket resurfacing of an entire district.
For a deeper look at surface-level material choices alone, see Nuvira’s companion piece on cool pavement and the urban heat island effect, which covers reflectivity thresholds in more technical detail than fits within this corridor-level analysis.
Layering Principle
These four types are not interchangeable — they are stacked. A wind corridor without canopy still moves hot air. A canopy corridor without permeable ground still radiates stored heat after sunset. The Nuvira design position is that resilience comes from redundancy: any two corridor types operating on the same street produce a compounding effect that a single intervention cannot replicate.
Sequencing Principle
The order in which a city builds its corridors matters as much as the corridors themselves. A common and costly mistake is to begin with the most visible, highest-budget segment — a signature plaza or a flagship waterfront park — while leaving the connective tissue between neighborhoods untouched. A refuge network only functions as a network once it forms an unbroken chain a resident can actually walk. Nuvira’s sequencing position is to build outward from the highest-exposure, lowest-canopy census tracts first, even when those tracts are politically less visible, because that is where the network delivers its first and most urgent unit of public health value. The flagship plaza can come later, once the connective spine already exists to plug it into.
Minimum Viable Network Specs
- Corridor spacing: no resident should be more than 400 meters — roughly a five-minute walk — from an entry point into the network.
- Canopy continuity: at least 60% continuous shade cover along a corridor’s pedestrian path during peak midday hours.
- Surface reflectivity: a minimum solar reflectance index appropriate to the local climate zone on all resurfaced corridor pavement.
- Redundant looping: corridors should form loops or grids rather than dead-end spurs, so a single blocked or closed segment does not sever refuge access for an entire district.
- Sensor density: distributed low-cost temperature and humidity sensors along each corridor, feeding a public dashboard rather than an internal planning document.
- Maintenance cadence: a published, funded maintenance schedule for canopy pruning, bioswale sediment clearing, and pavement inspection, reviewed annually rather than left to reactive repair.
None of these specifications is exotic. What is rare is the discipline of publishing them together, as a single coherent standard, rather than scattering canopy targets in a parks master plan, reflectivity targets in a public-works manual, and sensor requirements in a smart-city pilot memo that nobody outside one department ever reads. The corridor only becomes infrastructure once its specifications are unified and enforceable.
The Maintenance Governance Gap
Capital budgets get the headlines, but the network’s long-term survival depends on an unglamorous second question: who waters the trees in year seven, and who replaces the sensors in year twelve? Municipalities routinely fund the construction of green infrastructure while underfunding its stewardship, producing corridors that look complete on a ribbon-cutting day and decline steadily thereafter as canopy dies back and permeable pavement clogs with sediment.
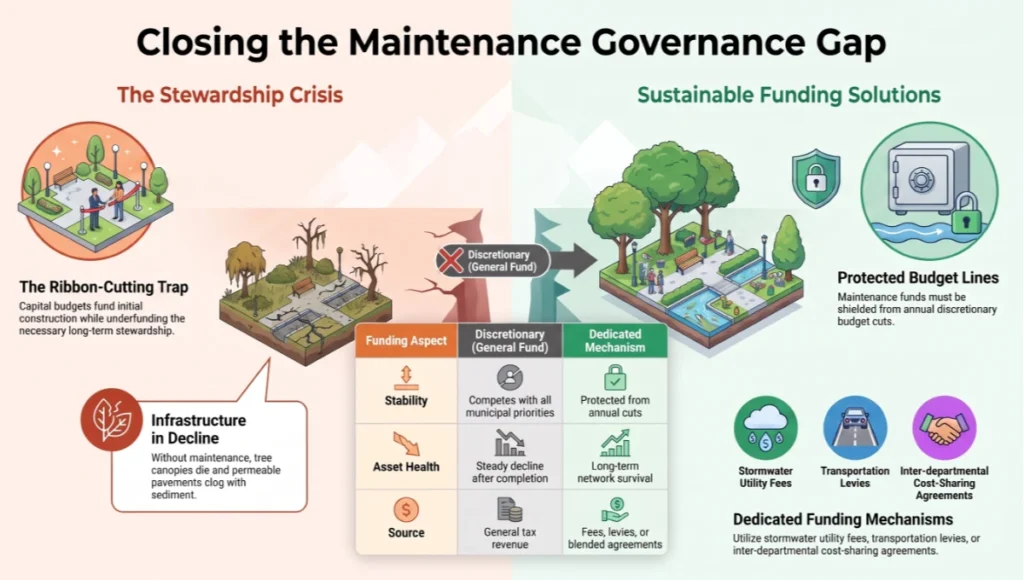
A durable network requires a maintenance budget line that is protected from annual discretionary cuts, ideally funded through a dedicated mechanism — a stormwater utility fee, a transportation levy, or a blended cost-sharing agreement between departments — rather than through a general fund that competes with every other municipal priority each budget season.
Singapore offers the most rigorously documented large-scale case study of engineered urban cooling anywhere in the world, precisely because its planners had no choice: a tropical, high-density island with almost no spare land cannot rely on suburban sprawl to dilute its heat load. Its national Green Plan commits to expanding green space and ensuring every resident lives within a ten-minute walk of a park, while its Landscaping for Urban Spaces and High-Rises scheme has pushed greenery vertically onto rooftops and building facades since it could not spread horizontally across the ground plane.
Measured data from built-up districts show daytime temperatures roughly zero to two degrees Celsius above forested reference sites, widening to two to four degrees at night, once trapped heat radiates back out of concrete and asphalt after dark.
Singapore’s planning response deliberately targets three fronts at once: shaping wind corridors between towers and optimizing shade at street level, reducing the heat absorbed by building envelopes and pavement, and cutting the waste heat emitted by air conditioning and traffic. Independent building-level studies have found that green roofs alone can lower pedestrian-level air temperature by roughly half a degree to just under two degrees Celsius — a modest number in isolation, but a meaningful one when stacked across an entire corridor of buildings rather than a single retrofit.
What makes Singapore instructive for you is not that it solved urban heat — no city has — but that it treated wind, shade, and vegetation as coordinated infrastructure decisions inside a single planning authority, rather than as separate departmental line items competing for the same budget. That coordination, more than any single technology, is the transferable lesson.
Nuvira has covered Singapore’s broader planning apparatus in more depth in our dedicated piece on Singapore’s green urban planning model, for readers who want the full policy architecture behind the corridor-level detail summarized here.
A Second Reference: Copenhagen
Copenhagen arrived at network-scale corridor thinking from a different emergency. A catastrophic 2011 storm flooded the city with roughly a meter of water and produced well over a billion dollars in damage, and the resulting Cloudburst Management Plan pushed the city toward what planners there call blue-green infrastructure — surface-level parks, boulevards, and retention basins that double as overland water routes during extreme rainfall. Enghaveparken, one of the plan’s signature projects, was rebuilt as a stepped, multi-level park capable of holding a substantial volume of stormwater in reserve basins while functioning as an ordinary recreational green space in dry weather.
The corridor lesson embedded in Copenhagen’s program is that a single piece of infrastructure can be engineered to solve two crises at once: the same tree canopy and retention landscaping that manages a cloudburst also produces shade and evaporative cooling during a heat event, and the same surface-level design logic that lets water move through a city without overwhelming its pipes lets air move through a city without stagnating between buildings.
Copenhagen’s utility has committed a multi-decade, multi-billion-krone investment to roll this approach out across dozens of catchment areas — evidence that a city can treat corridor infrastructure as a permanent capital program rather than a one-off pilot, provided the financing model spreads cost across the departments and time horizons that actually benefit from it.
C40 Cities has documented the financial case for this approach in detail in its Cities100 case study on Copenhagen’s green infrastructure program, which is worth reading alongside this analysis for its cost-benefit breakdown.
The following is a speculative internal concept study developed by Nuvira Space to test corridor logic against a generic mid-density, mid-latitude city district. It does not represent a commissioned or completed project.
Project Overview: Location / Typology / Vision
Location: A hypothetical mid-density European city of 800,000 residents — modeled on Seville, Spain, which recorded 61 heat-related deaths during the 2022 heat event and operates in a climate where summer temperatures now routinely exceed 40°C.
Typology: Distributed urban heat refuge network integrating all 5 typology nodes across 3 priority districts identified through a composite vulnerability index combining UHI severity, income quartile, elderly population density, and transit accessibility score.
Vision: To demonstrate that a city with legacy urban fabric — pre-1980 housing stock, low-albedo streetscapes, and fragmented public space — can be retrofitted with a thermally resilient network infrastructure at district scale within a 36-month implementation timeline, using primarily existing buildings and public space assets.
Design Levers Applied
Lever 1 — Vulnerability-First Spatial Mapping
- Composite heat vulnerability index (HVI) generated from: UHI intensity raster (Landsat thermal band), income percentile by census block, population aged 70+, distance to nearest mechanical cooling source
- Priority zones identified: 3 districts covering 22% of city area but accounting for 67% of modeled heat-mortality risk
- Network node placement algorithm: maximal coverage location problem (MCLP) methodology optimizing for 400m proximity threshold across priority zone residential population
Lever 2 — Retrofit Activation Protocol
- Existing public buildings within priority zones assessed against 6 activation criteria: thermal mass, ventilation capacity, operating hours, mobility access, occupancy capacity, emergency generator backup
- 47 buildings identified as Type 2 activation candidates; 31 assessed as immediately activatable with operational protocol changes only (no capital works required)
- Estimated cost of Type 2 activation across 31 buildings: EUR 2.3M (signage, extended staffing, seating, communication systems)
Lever 3 — Data-Activated Network Intelligence
- IoT sensor network deployed at 120 locations across priority zones: ambient temperature, humidity, WBGT, UV index, and pedestrian footfall
- Alert integration: network activation triggered at WBGT 32°C sustained for 90 minutes — linked to municipal emergency notification system
- Performance dashboard: real-time occupancy, temperature performance, and network coverage visualization accessible to city operations and public
- Predictive model: 48-hour heat forecast integration to pre-position mobile cool units and extend operating hours before emergency threshold is reached
Lever 4 — Equity Closure Mechanisms
- Proximity audit: annual GIS review measuring percentage of priority-zone residents within 400m of an activated refuge node
- Temporal audit: mystery visitor monitoring to verify actual operating hours against protocol commitments during heat advisory periods
- Accessibility audit: mobility-inclusive access assessment against EN 17210 for all Type 2–5 nodes, with mandatory remediation timeline
- Language audit: communication materials reviewed against district language demographics annually
Transferable Takeaway
Project THERMA GRID demonstrates a city-agnostic principle: the three equity gaps in urban heat refuge networks are not closed by capital expenditure alone. They are closed by governance design — by establishing measurable proximity, temporal, and accessibility standards and building the monitoring architecture to enforce them. The most expensive intervention in the THERMA GRID concept is the data network. The most impactful intervention is the policy framework that gives the data operational consequences.
Every city with a heat vulnerability problem and a stock of existing public buildings already has the raw material for a Type 2 network. The design challenge is activation, governance, and the political commitment to hold operating hours and accessibility standards through the years when temperatures are merely uncomfortable rather than lethal.
2030 Future Projection: The Cities That Adapt and the Cities That Don’t
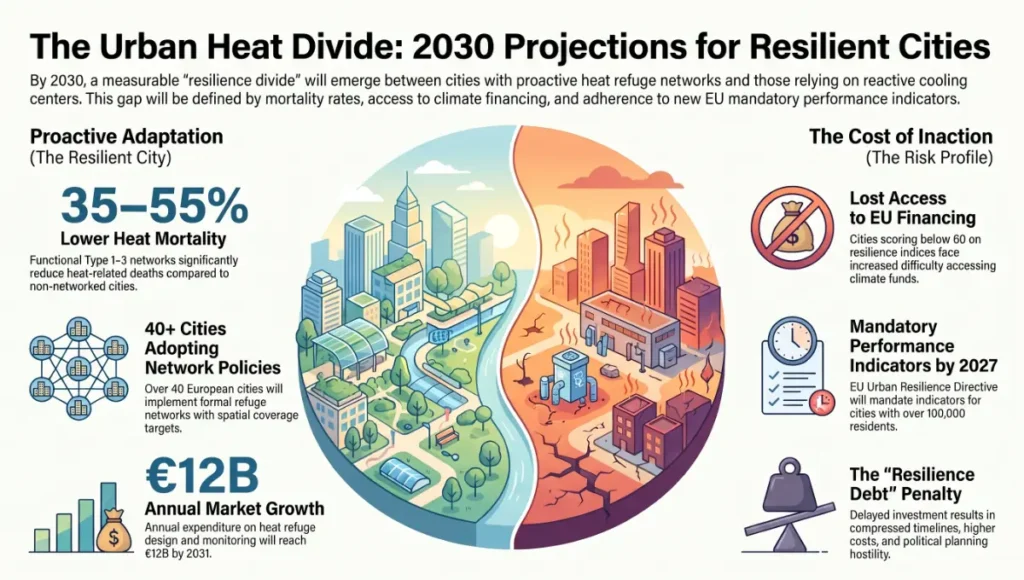
By 2030, the divergence between cities that have built functional urban heat refuge networks and those still operating reactive cooling center programs will be measurable in mortality statistics, insurance premiums, and international climate compliance ratings.
The EU’s emerging Urban Resilience Directive framework — currently under consultation — is expected to establish mandatory heat adaptation performance indicators for cities above 100,000 residents by 2027. WHO’s Heat Health Action Plan, updated in 2024, already recommends network-based refuge systems as the minimum standard for urban heat emergency preparedness in any city recording more than 5 days per year above 35°C.
- Projection: by 2030, 40+ European cities will have formally adopted urban heat refuge network policies with spatial coverage targets
- Projection: cities without heat resilience infrastructure scoring above 60 on emerging standardized indices will face increased difficulty accessing EU climate adaptation financing
- Projection: urban heat mortality in cities with functional Type 1–3 networks is projected to be 35–55% lower than comparable cities without network infrastructure, based on modeled intervention data
- Projection: the urban heat refuge sector — design, installation, monitoring, and governance consultancy — is projected to reach EUR 12B in annual expenditure across EU member states by 2031
- Risk projection: cities that delay network investment until after the next major heat emergency will face compressed timelines, higher costs, and political environments hostile to deliberate spatial planning
The window for rational, equity-led investment in urban heat refuge networks is the present. Not the next emergency. The cities that understand this are already building. The cities that don’t are accumulating a debt measured in lives.
Comprehensive Technical FAQ
Part of our urban systems guide — the field guide to resilient urbanism.
Q: What is the minimum viable urban heat refuge network for a city of 500,000?
A: A minimum viable network for a mid-size city requires:
- Coverage target: 80% of residential population within 400m of a Type 1–3 refuge node
- Node count: approximately 120–180 nodes across all 5 typologies, weighted toward Types 1 and 2
- Operating hours: minimum 06:00–22:00 during heat advisory periods, with 24-hour passive access at 20% of nodes
- Data infrastructure: minimum 60 environmental sensors networked to a central monitoring dashboard
- Governance: a cross-departmental heat resilience coordinator role with budget authority across health, planning, and parks departments
Q: How is urban heat island severity measured and classified?
A: UHI severity is typically assessed through a combination of:
- Landsat 8/9 thermal infrared sensor data providing land surface temperature (LST) at 30m resolution
- MODIS daily surface temperature composites for trend analysis over multi-year periods
- Ground-level air temperature monitoring networks (IoT-based) calibrated against national meteorological standards
- Severity classification scale: Level 1 (0–2°C above rural baseline) through Level 4 (6°C+ above rural baseline); Level 3+ triggers mandatory network density standards under emerging EU frameworks
Q: What is the evidence base for the 400m proximity threshold?
A: The 400m threshold derives from multiple converging evidence sources:
- WHO Urban Health Equity Assessment and Response Tool (Urban HEART) recommends 400m as the maximum acceptable distance to essential public health infrastructure for mobility-impaired users
- Barcelona’s Climate Shelter program uses a 5-minute walk standard, equating to approximately 350–400m at average pedestrian speed; the program adjusts to 200m in districts with high elderly population density
- MCLP spatial optimization studies in Los Angeles and Portland found that reducing the threshold below 400m produced diminishing returns in coverage at disproportionate cost, while exceeding 400m significantly increased non-use among target populations
Q: How do urban heat refuge networks integrate with transit-oriented development?
A: The integration potential is substantial and largely unrealized in current practice:
- Transit nodes — bus interchanges, metro entrances, tram stops — are among the highest pedestrian footfall locations in any urban district and represent natural Type 2 or Type 3 refuge anchor points
- TOD frameworks that incorporate thermal refuge standards into station area planning can deploy cool nodes at transit facilities at marginal additional cost relative to standalone deployment
- Singapore’s Cool Corridor model explicitly connects all refuge typologies to the MRT network, ensuring that residents traveling to and from transit access points traverse a thermally conditioned pedestrian environment
- Design principle: every transit interchange serving more than 5,000 boardings per day should incorporate a Type 3 node (minimum) with 24-hour passive access capability
Q: What are the key performance indicators for an urban heat refuge network?
A: A robust KPI framework for network performance covers 4 dimensions:
- Coverage KPI: percentage of priority-zone residential population within 400m of an activated node — target: 80% minimum, 95% aspirational
- Temporal KPI: percentage of heat advisory hours during which all designated nodes are confirmed operational — target: 98% compliance
- Accessibility KPI: percentage of nodes meeting EN 17210 mobility access standards — target: 100% by Year 3 of network operation
- Utilization KPI: refuge nodes achieving minimum occupancy threshold of 15% of seating capacity during peak heat advisory hours — low utilization triggers communication and outreach review
Q: How should cities fund urban heat refuge network development?
A: A diversified funding architecture is most resilient:
- EU Cohesion Policy / ERDF: Urban Resilience and Climate Adaptation eligible expenditure streams — typically 40–70% co-funding available for qualifying municipalities
- National health budgets: heat mortality cost offset justification enables health ministry co-investment in network infrastructure with public health framing
- Private sector partnership: commercial real estate operators, particularly retail and hospitality, can co-fund Type 3 nodes adjacent to their assets with mutual benefit in footfall and corporate climate commitments
- Carbon credit mechanism: urban heat reduction interventions are increasingly eligible for voluntary carbon market credits where they demonstrably reduce urban energy consumption through passive cooling effects
The Heat Is Not Coming. It Is Already Here.
Urban heat refuge networks are the most underbuilt critical infrastructure category in the contemporary city. The three equity gaps — geographic proximity failure, temporal availability collapse, and mobility-inclusive access design absence — are not technical problems awaiting a technological solution. They are governance failures awaiting a political one.
You are building, advising, governing, or funding the city of 2030 right now. The thermal resilience of that city — its capacity to protect its most vulnerable residents during the heat events that climate models describe not as possibilities but as certainties — will be determined by the decisions your sector makes in the next 36 months. The network design exists. The evidence base is deep. The financing mechanisms are available.
What urban heat refuge networks require now is not further research. They require cities with the institutional courage to build them equitably, maintain them consistently, and measure them honestly. The gap between what is technically possible and what is politically delivered is where people die.
Build the network. Close the gaps. Treat thermal resilience as infrastructure — because it is.
© Nuvira Space All rights reserved. | URBAN PULSE Series | All specifications cited are based on published municipal heat resilience reports, WHO Heat Health Action Plan (2024), Barcelona Climate Shelter Municipal Data 2023, Singapore HDB Cool Corridor Pilot Reports 2024, and peer-reviewed urban climate adaptation literature (MDPI Urban Science Vol. 10 No. 2, 2026; ScienceDirect Environmental Research). The THERMA GRID Project is a speculative internal concept study and does not represent a completed project.
Q: How wide does a cool corridor need to be to produce a measurable cooling effect?
A: There is no single universal figure, but planning studies generally treat a continuous shaded pedestrian band of at least 3 to 4 meters, paired with adjacent canopy cover, as the practical minimum for producing a noticeable drop in perceived temperature at street level.
Q: Can a cool corridor network be retrofitted onto an existing street grid, or does it require new construction?
A: Retrofit is the dominant real-world path. Most cities lack unclaimed land for greenfield corridors, so networks are typically built by reclaiming excess vehicle lane width, underused parking, and negotiated building setbacks along streets the municipality already controls.
Q: What is the difference between a wind corridor and a canopy corridor?
A: A wind corridor is a spatial design choice — building orientation and setback — that keeps air moving through a district. A canopy corridor is a vegetative intervention that blocks direct solar radiation at street level. They solve different halves of the same problem and are most effective layered together.
Q: Who typically pays for a citywide heat refuge network?
A: Funding is almost always blended — transportation budgets cover lane reclamation, parks budgets cover canopy planting and maintenance, and water utilities cover bioswale and permeable-pavement components — which is precisely why a single coordinating authority materially improves delivery speed.
Q: How long does a newly planted canopy corridor take to reach effective cooling capacity?
A: Fast-maturing shade species can begin providing meaningful pedestrian-level cooling within five to eight years, though full canopy closure — the point at which a corridor achieves continuous overhead shade — often takes fifteen to twenty years. This is a strong argument for prioritizing existing mature trees for protection over new plantings wherever a corridor route can be drawn around them.
Q: Do cool corridors only benefit pedestrians, or do they reduce citywide energy demand as well?
A: Both. Shaded, lower-temperature streets reduce the surface and ambient air temperature reaching adjacent buildings, which measurably lowers air-conditioning demand during peak afternoon hours. At network scale, this can meaningfully flatten a city’s summer electricity demand curve, reducing the risk of the grid strain that often accompanies extreme heat events.