

Table of Contents
Macro-Observation
Generative diagramming architecture is no longer a peripheral experiment happening inside university research labs or boutique parametric studios. It is the operational baseline for every serious design practice that intends to remain competitive between now and 2030. The shift is not subtle: firms across Rotterdam, Singapore, and Copenhagen are replacing static schematic workflows with AI-assisted, constraint-driven diagramming pipelines that simultaneously resolve spatial logic, structural feasibility, and environmental performance.
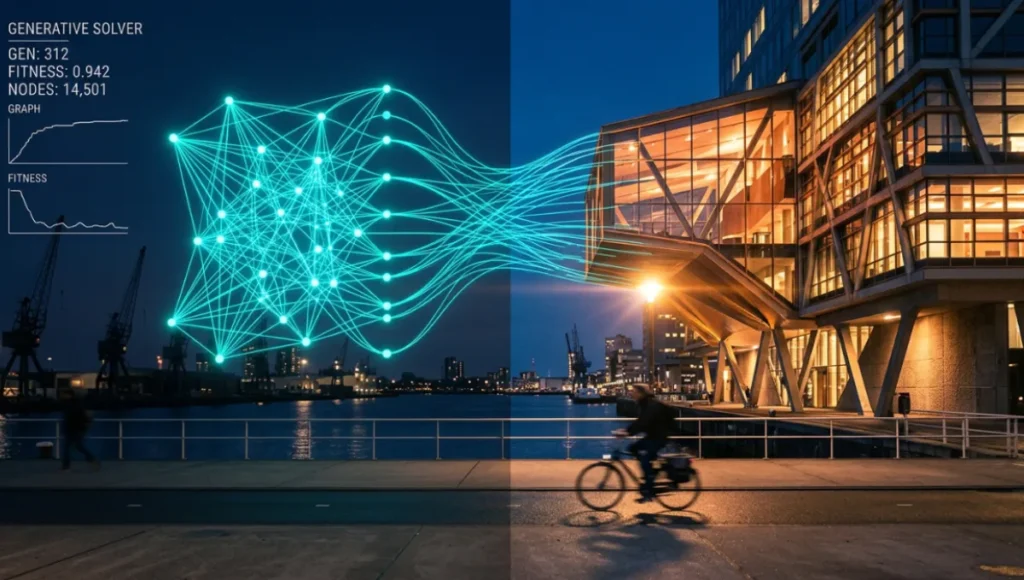
What was once a six-week pre-design phase is collapsing into a 72-hour iterative loop, and the visual intelligence driving that compression is a direct product of how diagramming itself has been re-engineered.
The conventional architectural diagram—a hand-traced abstraction of a singular concept—has been adequate for a century of practice built around slow iteration and client-managed risk. That model is broken. The moment computational logic could be injected directly into the diagram layer, design intent and design output became the same continuous surface. You are not producing a drawing and then a building. You are navigating a parametric decision tree that generates both in parallel, and the fidelity of that navigation is the product of your diagramming architecture’s intelligence.
Nuvira Perspective
At Nuvira Space, we operate from a single governing thesis: the most consequential gap in contemporary architectural production is not between design intent and structural execution—it is between the “invisible logic” of a design concept and its capacity to be made legible, testable, and iterable at speed. Generative diagramming architecture is the discipline that closes that gap. Where legacy workflows force designers to serialize insight through rigid linear phases, generative diagramming collapses those phases into a live, topologically aware system where spatial intent, performance constraint, and visual communication co-evolve.
Our work at the intersection of real-time engines—Unreal Engine 5.4, Houdini 20.5, and NVIDIA Omniverse—with multi-agent diagramming systems has demonstrated that human-machine synthesis in the diagram layer is not a philosophical position. It is a measurable production advantage. The AIA’s resources on the role of diagrams in architectural design underscore this shift—diagrams have become generative engines, not merely communication tools.
When a Lumen-lit spatial diagram can propagate constraint changes in under 400 milliseconds and output an updated environmental analysis simultaneously, the architect’s cognitive load shifts from translation to judgment. That is the core of what Nuvira builds toward: real-time engines and high-fidelity simulation not as visualization tools, but as the connective tissue between digital intent and architectural reality.
Step-by-Step Workflow & Features
The following workflow maps the full generative diagramming architecture pipeline from raw brief intake to deployable spatial output. Each phase is discrete but non-linear—constraint signals from Phase 4 can re-trigger Phase 2 without manual intervention.
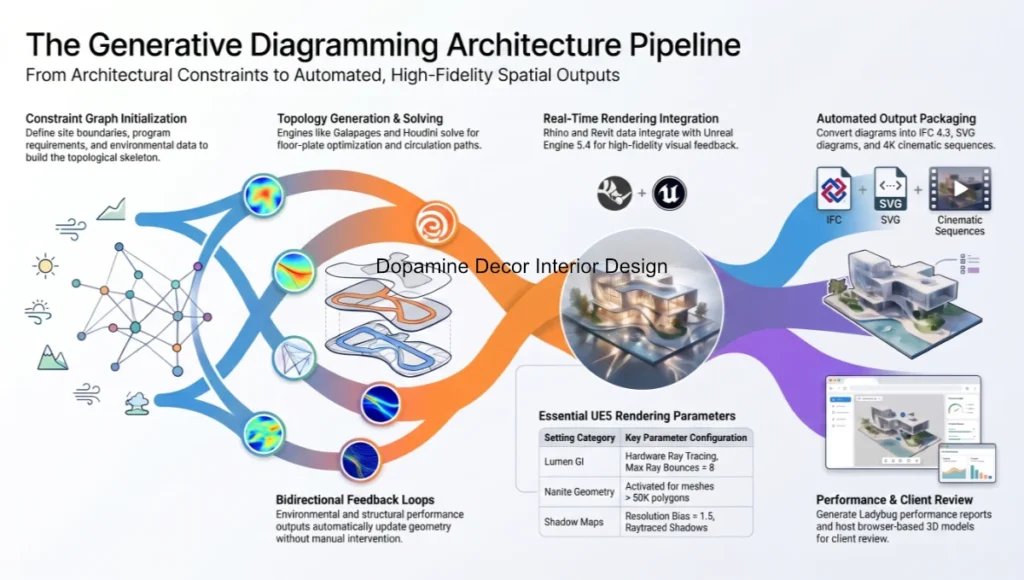
Phase 1 — Constraint Graph Initialization
Before any geometry exists, you define the constraint graph—the topological skeleton of design intent. Tools at this phase include Grasshopper 1.0 (Rhino 8 build), Houdini PDG, and SpaceMaker by Autodesk. Your inputs:
- Site boundary as a geo-referenced polygon (GeoJSON or DXF import)
- Program requirements: gross area per function, stacking preferences, adjacency matrix
- Environmental data: solar path (EnergyPlus EPW file), prevailing wind vector, acoustic boundary
- Regulatory envelope: FAR, setbacks, height restriction planes as parametric solids
- Structural module preference: grid pitch in mm, primary material system (CLT, concrete, steel)
Phase 2 — Topology Generation & Spatial Logic Solving
With the constraint graph active, you trigger the topology solver. Recommended engines at this phase:
- Grasshopper + Galapagos: genetic algorithm for floor-plate optimization
- Houdini VEX solvers: flow-field based circulation path generation
- Spacemaker AI: urban-scale massing generation with solar and wind feedback
- Forma (Autodesk): real-time microclimate iteration on massing variants
At this phase the diagram is not illustrative—it is computational. Every stroke you see represents a solved constraint state. The visual output is a byproduct of logic resolution, not a precursor to it.
Phase 3 — Real-Time Rendering Layer Integration
Once the topology is resolved, you pipe the output directly into a real-time global illumination environment. The critical integration bridge is the Datasmith workflow from Rhino or Revit into Unreal Engine 5.4. Key parameter settings:
- Lumen Global Illumination: Hardware Ray Tracing enabled, Max Ray Bounces = 8, Scene Capture = 4096px
- Nanite Virtualized Geometry: activated for all imported mesh assets above 50K polygons
- Virtual Shadow Maps: Resolution Bias = 1.5, Raytraced Shadows for key-light only
- Temporal Super Resolution (TSR): Screen Percentage = 67, upscaled to 4K target
- Sky Atmosphere + Volumetric Clouds: Real-Time Capture enabled, Multi-Scatter approximation ON
- Post-Process Volume: Exposure Compensation = −0.3 EV, Film Grain Intensity = 0.25, Chromatic Aberration = 0.1
Phase 4 — Feedback Loop & Diagram Propagation
The feedback loop is where generative diagramming architecture diverges most radically from conventional BIM workflows. Instead of sequential hand-offs, constraint propagation runs bidirectionally:
- Environmental performance outputs (daylight factor, shadow hours) re-enter the topology solver as weighted constraints
- Structural feasibility flags from a Karamba3D analysis update the floor-plate geometry in Grasshopper without user intervention
- Each topology variant triggers an automated visual output via Datasmith → Unreal pipeline in under 90 seconds
- Versioning is handled by a Git-based Grasshopper Hops server, enabling parallel variant management
Phase 5 — Output Packaging & Documentation
The final phase converts living diagram data into deliverable artifacts. Your output stack should include:
- IFC 4.3 export for BIM coordination (Revit or ArchiCAD handoff)
- SVG-based diagram set with embedded constraint metadata (readable by Figma, Adobe Illustrator)
- Unreal Engine cinematic sequence: 4K EXR frame stack for Nuke or DaVinci Resolve color grading; for site-capture integration, NeRF-based architectural visualization pipelines can inject photogrammetric context directly into the UE5 scene
- Performance report: CSV from Ladybug Tools with annual daylight autonomy, EUI prediction, carbon estimate
- Client-facing web viewer: Speckle.works or Forma Share for browser-based 3D diagram navigation
Comparative Analysis: Nuvira vs. Industry Standard
The distinction between a generative diagramming architecture pipeline and a conventional computational design workflow is not merely technical—it is architectural in the deepest sense. Below is a direct comparison across six performance dimensions.
Iteration Velocity
Industry Standard (BIM-first, Revit + AutoCAD): A single massing iteration cycle—brief to compliant schematic—runs 3–5 business days, gated by sequential review. Design intent lives in the architect’s head; geometry is the only artefact. Constraint changes require full manual re-draw.
Nuvira Generative Pipeline: The same cycle runs in 4–12 hours. Constraint propagation is automatic. When a client changes the program brief, the solver re-runs, generates 12 compliant topology variants, and updates the Unreal scene within one working session. Iteration is the default state, not the exception.
Visual Fidelity During Design Development
Industry Standard: High-fidelity visualization is a Phase 3 or 4 deliverable. During schematic design, clients see flat diagrams, sketch models, and 2D plans. The visual disconnect between intent and form is a known source of client misalignment and costly late-stage revisions.
Nuvira Generative Pipeline: Real-time Lumen illumination is active from Phase 2. Every topology variant is navigable in first-person view in Unreal before structural engineering begins. Clients experience spatial quality at the constraint-solving stage, eliminating an entire category of expectation mismatch.
Environmental Performance Integration
Industry Standard: Energy modeling and daylight simulation are outsourced to specialist consultants post-schematic. Results arrive weeks after design decisions are locked, limiting actionable feedback to expensive redesigns.
Nuvira Generative Pipeline: Ladybug Tools runs parallel to the topology solver. Annual daylight autonomy and UDI scores update with every massing variant. Decisions on façade orientation, floor-plate depth, and atrium geometry are made with live performance data, not consultant reports.
Singapore Case Study: Marina South Precinct
The Urban Redevelopment Authority’s Marina South masterplan in Singapore represents one of the most data-intensive urban design briefs of the decade: 9 hectares of mixed-use development constrained by tropical solar angles, NEA wind corridor requirements, and MRT integration geometry. Firms engaging this brief through conventional BIM workflows face a fundamental data-management problem—the constraint set is too large to hold in any single schematic model.
Generative diagramming architecture pipelines, by contrast, treat the constraint graph as the primary design artefact. Every spatial decision is a solved constraint state, not a geometric intuition. The practical result is that a compliant massing can be generated in 18 hours rather than 18 weeks, and each variant carries an embedded performance certificate. This is the operating standard that generative diagramming architecture is setting for complex urban briefs worldwide.
Concept Project Spotlight
⚠ Speculative / Internal Concept Study — Project Meridian Lattice by Nuvira Space
Project Overview
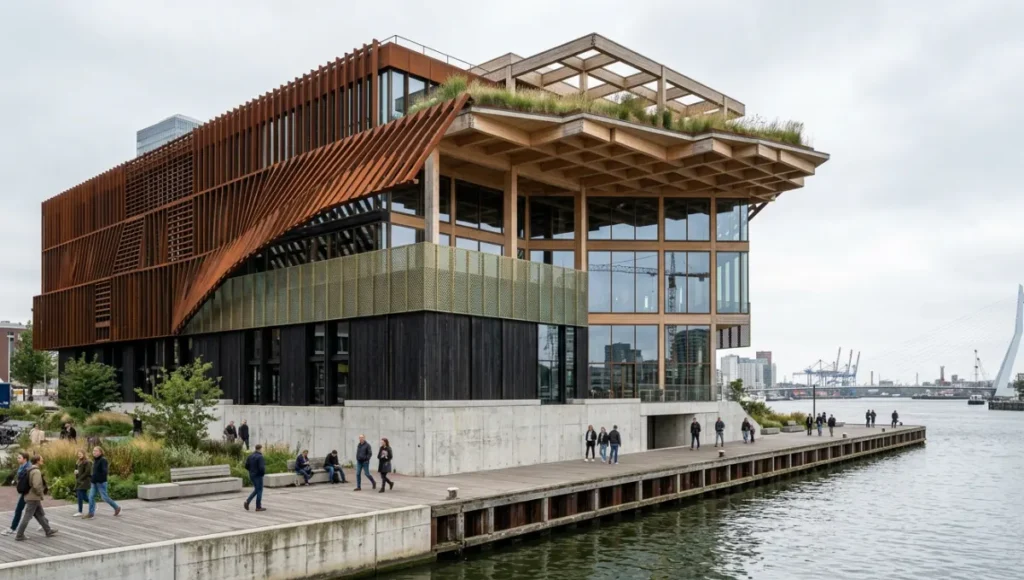
- Location: Rotterdam Waterfront, Netherlands — Rijnhaven Basin, 51.9°N latitude
- Typology: Mixed-use civic hub — cultural facility + co-working + public waterfront activation
- Vision: A generative diagram-first design study exploring how multi-agent constraint solving can produce a building whose form is entirely traceable to its performance logic, with zero manually authored geometry in the base model
Design Levers Applied
Constraint Graph Configuration
- Solar constraint: Maximum 40% direct solar exposure on primary public façades (Rotterdam winter solstice angle: 14°)
- Wind constraint: No average wind speed above 5 m/s at pedestrian-level zones (Beaufort 3 threshold)
- Structural grid: 8.4m primary CLT grid, 2.8m secondary coffered slab module
- Program stack: 4,200 m² cultural program (floors 1–2), 6,800 m² co-working (floors 3–5), 1,400 m² public roof terrace
Generative Diagramming Pipeline Parameters
- Solver: Galapagos (fitness function weighted 60% solar / 25% wind / 15% program adjacency)
- Topology iterations: 847 variants generated in 6.3 hours on a single RTX 4090 workstation
- Top-ranked variant: 12.2% annual energy use reduction vs. Rotterdam baseline, daylight autonomy = 78% across occupied floors
- Unreal Engine scene: 1.4M Nanite polygons, Lumen GI at Hardware RT, TSR upscale from 1440p to 4K
- Render time per frame (cinematic sequence): 34ms at runtime, EXR export at 4096×2160
Transferable Takeaway
The core learning from Meridian Lattice is not about the building—it is about the diagram. When every geometric decision is a logged constraint resolution, design authorship becomes fully auditable. Clients, engineers, and planners can trace any facade angle or floor-plate depth back to the specific performance criterion that generated it. This auditability is the commercially significant outcome of generative diagramming architecture: it transforms design justification from a narrative into a data log.
Intellectual Honesty: Hardware Check
Generative diagramming architecture pipelines are computationally demanding. Before committing your practice to this workflow, you need an honest accounting of what your current hardware can and cannot do.
- Minimum viable setup: NVIDIA RTX 3080 (12GB VRAM), 64GB DDR5 RAM, NVMe SSD ≥ 2TB, Intel Core i9-13900K or AMD Ryzen 9 7950X. At this spec, Houdini PDG simulations and Grasshopper solvers run adequately. Unreal Engine 5.4 with Software Lumen is viable; Hardware Ray Tracing is marginal.
- Recommended studio setup: NVIDIA RTX 4090 (24GB VRAM), 128GB DDR5 RAM, RAID-0 NVMe array ≥4TB. This spec supports full Hardware Lumen, Nanite at cinematic density, and parallel Grasshopper → Datasmith → UE5 pipeline without bottleneck.
- Cloud-scale option: AWS P4d instances (NVIDIA A100 ×8) for batch topology solving. Galapagos on 1,000+ variant populations completes in under 2 hours vs. 14+ hours on a single local workstation.
- GPU VRAM is the most critical single variable. Scenes with Nanite + Lumen + Volumetric Clouds + TSR require a minimum 16GB VRAM to avoid VRAM eviction artifacts at 4K.
- Do not run Houdini, Grasshopper, and Unreal Engine simultaneously on systems below 64GB RAM. Memory pressure causes solver timeouts and corrupts Grasshopper → Datasmith cache files.
2030 Future Projection
The trajectory of generative diagramming architecture between now and 2030 is not speculative—it is already written in the product roadmaps of Autodesk, NVIDIA, McNeel, and the Sidefx Houdini team. The direction is total integration:
- Multi-agent AI solvers will replace single-objective genetic algorithms as the primary topology engine. Systems like Autodesk’s Project Bernini are already generating 3D geometry from text + constraint input. By 2027, the constraint graph will be conversationally editable.
- NVIDIA Omniverse will become the universal exchange format. The fragmented Rhino → Grasshopper → Revit → Unreal pipeline will compress into a single USD-native simulation environment where all discipline models co-exist in one scene graph.
- Real-time regulatory compliance checking will be embedded at the diagram layer. Singapore’s BCA and CORENET X platform is already moving toward API-accessible code compliance. By 2028, a constraint graph will be able to query building code databases in real time during topology solving.
- The role of the architectural diagram will formally split into two branches: the performance diagram (machine-generated, constraint-resolved) and the communication diagram (human-authored, narrative-driven). Both will have distinct software toolchains.
- Copenhagen’s 2030 carbon-neutral building target will drive the adoption of generative diagramming in municipal planning approvals. Diagrams that cannot produce an embedded lifecycle carbon certificate will not pass pre-application review.
Secret Techniques: Advanced User Guide
These are not widely documented. They represent techniques developed through production use rather than tutorial coverage.
- Fitness Function Weight Decay in Galapagos: Set your solar constraint weight to 0.8 at generation 0, then script a linear decay to 0.4 by generation 50. This prevents the solver from over-optimizing for a single criterion early and missing topologically interesting solutions that score well across all criteria late in the run.
- Houdini Packed Primitives for Mass Diagram Export: When exporting topology variants from Houdini to Rhino via FBX, pack all variant geometry into Houdini Packed Primitives before export. This reduces file size by 60–80% and preserves attribute data (solar score, wind score, program adjacency score) as custom vertex colors readable in Rhino.
- Unreal Engine World Partition for Diagram Scale: For urban-scale generative diagrams (city blocks, masterplans), enable World Partition in UE5.4 and set the Data Layer for each topology variant as a separate layer. This allows real-time variant switching inside a single persistent Unreal level without reloading the scene.
- Karamba3D Pre-Solve as Constraint Filter: Before running Galapagos on large populations, run a rapid Karamba3D buckling analysis on a population sample (50 members). Discard all members where the utilization ratio exceeds 0.85. This eliminates structurally invalid variants before the main optimization run, cutting computation time by 30–40%.
- Ladybug Radiation Rose as Massing Bias: Export the annual radiation rose from Ladybug as a vector field, then use it as a Houdini VEX attractor to bias floor-plate elongation toward low-radiation orientations. This encodes environmental logic into massing geometry without manual design intervention.
Comprehensive Technical FAQ
Q: Is Rhino + Grasshopper still the right entry point for generative diagramming architecture in 2025, or has something displaced it?
A:
Rhino 8 + Grasshopper remains the most accessible and professionally supported entry point for constraint-driven diagramming. The addition of SubD, Shrinkwrap, and native Python 3 scripting in Rhino 8 extends its capability into territory that previously required Houdini. However, for projects requiring multi-disciplinary data exchange, population-scale optimization, or real-time simulation, Houdini 20.5 is the more powerful environment. The practical answer: use Grasshopper for architecture-scale projects and client-team collaboration. Introduce Houdini for research-phase exploration and urban-scale solver work.
Q: Can generative diagramming architecture integrate with a standard Revit-based BIM workflow, or does it require a full pipeline replacement?
A:
Integration is possible, not seamless. The practical bridge is the Grasshopper → Rhino.Inside.Revit stack, which allows Grasshopper definitions to write directly to Revit elements. Constraint-resolved geometry from Galapagos can populate Revit families and schedules automatically. The limitations:
- Revit’s parametric system does not support topological variation—you cannot have a solver-generated floor plate that changes column count between variants inside a single Revit model
- Schema conflicts between Grasshopper geometry attributes and Revit category types require manual mapping
- For early-stage generative work, keep the pipeline in Rhino/Grasshopper and export to Revit only when the design is topologically locked
Q: What ray-tracing settings in Unreal Engine 5.4 provide the best performance-to-fidelity ratio for architectural diagram visualization?
A:
For real-time diagram navigation (interactive client presentations), this configuration delivers the highest perceptual fidelity at interactive frame rates on an RTX 4090:
- Lumen: Hardware Ray Tracing ON, Software Ray Tracing as fallback, Final Gather Quality = 1.0
- Virtual Shadow Maps: Enable = true, Resolution Bias = 1.0 (increase to 1.5 for close-up facade detail)
- Temporal Super Resolution: Screen Percentage = 67 (native 1440p upscaled to 4K), Anti-Ghost = 0.4
- Ray Traced Reflections: OFF for interactive sessions (VSM handles glass adequately), ON for cinematic renders
- Global Illumination: Lumen Scene Detail = 1.0, Lumen Scene View Distance = 2000m for urban-scale diagrams
- Post-Process: Enable Path Tracing for final cinematic output only (non-interactive, 128 samples minimum)
Q: How do you manage version control across hundreds of generative diagram variants without losing traceability?
A:
The most robust system in current production use is a combination of:
- Grasshopper Hops server hosted locally or on a cloud instance: each Grasshopper definition is a microservice, versioned as a separate repository
- Git LFS (Large File Storage) for Rhino geometry caches (.3dm files): store constraint inputs as JSON (lightweight, diffable), geometry as LFS-tracked binary
- Speckle.works for multi-disciplinary sharing: each variant is a Speckle commit with a unique hash, navigable via browser without Rhino installed
- SQLite database alongside the solver run: log every variant’s fitness scores, constraint satisfaction values, and generation number. This becomes the ‘design audit trail’ for planning submissions
Q: What is the most common failure point in generative diagramming architecture pipelines, and how do you prevent it?
A:
The most common failure is garbage-in on the constraint graph. If your site boundary is not geo-referenced, your solar path EPW file does not match the project location, or your program adjacency matrix contains logical contradictions, the solver will generate results that are mathematically optimal and architecturally nonsensical. Prevention protocol:
- Validate all geographic inputs against a reference GIS layer before solver initialization
- Run a constraint conflict check: test all pairwise constraint combinations for logical contradictions before the full population run
- Limit the first production run to 50 variants. Review the top 10 manually before scaling to 500+
- Assign a human ‘constraint reviewer’ role—one team member who checks solver outputs against the brief qualitatively, not just quantitatively
Start Building Your Generative Diagramming Architecture Pipeline
Generative diagramming architecture is not a trend to monitor from a distance. It is a production methodology that is actively separating practices that can execute complex briefs at speed from those that cannot. The firms winning mixed-use urban commissions in Singapore, Rotterdam, and Copenhagen right now are not doing so on the strength of better design instincts—they are doing so because their diagramming infrastructure lets them field 20 compliant variants in the time it takes a conventional practice to produce one.
Your entry point does not need to be radical. Start with Rhino 8 + Grasshopper and a Galapagos fitness function tied to one real constraint from your next brief—solar hours on the primary facade, or floor-plate depth relative to structural span. Run 100 variants. Compare the top 10 against what you would have drawn by hand. The gap between those outputs is the argument for this workflow more clearly than any case study can make it.
The Nuvira Space Visual Lab team publishes workflow breakdowns, solver configurations, and Unreal Engine parameter sets for each project in The Visual Lab series. Every specification in this guide is grounded in production-tested practice. The next iteration of your diagramming architecture starts with the next brief on your desk.
© Nuvira Space — All rights reserved. THE VISUAL LAB SERIES. All specifications cited are based on Unreal Engine 5.4 documentation (Epic Games, 2024), Grasshopper + Galapagos solver reference (McNeel & Associates, 2024), Houdini 20.5 PDG documentation (SideFX, 2024), Ladybug Tools environmental simulation library (v1.8, 2024), Rhino.Inside.Revit API reference (McNeel, 2024), and NVIDIA Omniverse USD technical documentation (NVIDIA, 2024).
The Project Meridian Lattice is a speculative internal concept study and does not represent a completed project.