

Table of Contents
Walk a city block at eleven at night in July and the heat you feel is not weather — it is the accumulated signature of surfaces that absorbed the day and cannot let go. Cities run hotter than their surroundings — the urban heat island (UHI) effect — with the gap concentrated in specific districts, at specific hours, against specific populations. This guide explains how heat islands form, how severity is measured and classified, what mitigates them, and how exposure maps onto equity. It is the measurement companion to our heat refuge networks guide: that page builds the refuges; this page diagnoses the heat.
Key takeaways
- The heat island is a design output, not a weather event: surfaces, canopy, canyon geometry, and waste heat decide where the city stores the day’s energy.
- Measure before you mitigate — surface temperature, air temperature, and health outcomes are three different datasets, and a plan built on one of them alone is a hypothesis.
- Classify severity, target the portfolio to the classification, then verify against the same taxonomy, or the before-and-after comparison proves nothing.
- Timing decides targeting: thermal mass shifts peak danger into evening hours, exactly when cooling centres close and vulnerable residents are home.
- Exposure is distributed as unequally as canopy: target by exposure-weighted need, fund maintenance where stewardship capacity is thinnest, and report tract-level outcomes.
Nuvira Perspective
At Nuvira Space, we read urban heat as a design output, not a weather event — the thermodynamic signature of decisions about surfaces, canopy, ventilation, and who lives downwind of what. Most heat writing either terrifies or generalizes; both fail the planner holding a budget. Our position: measure first at district resolution, target interventions by exposure rather than by visibility, and verify performance against the classification you started from. Heat you cannot map, you cannot mitigate — and heat mapped without equity analysis gets mitigated where it photographs best instead of where it harms most.
Physics: why cities overheat
Four mechanisms stack. Dark impervious surfaces — asphalt, conventional roofing — absorb solar radiation and re-emit it as heat; pavements and roofs shape the microclimate through this energy balance directly. Missing evapotranspiration: vegetation cools by shade plus water vapor release, and its removal eliminates both pathways at once. Canyon trapping: street geometry and building mass slow nocturnal cooling by blocking sky-view radiative release and ventilation. Waste heat: vehicles, buildings, and industry add anthropogenic flux on top. Nighttime temperatures diverge most — the island is clearest when the countryside cools and the city cannot.
Measurement and classification
Severity is measured as the urban–rural temperature differential, stratified by surface versus air temperature and by day versus night, then classified into intensity bands that drive intervention priority. Satellite land-surface readings map patterns; street-level sensor traverses and fixed arrays confirm what people actually experience; health surveillance (heat illness, excess mortality during events) weights the human outcome. Our heat-refuge coverage details severity classification and the evidence behind proximity thresholds — measure with the same taxonomy you will later verify against, or the before/after comparison is meaningless.
Nuvira Space · Urban Pulse
Heat mitigation targeting planner
Diagnosis precedes prescription. Say which thermal condition dominates the district and how exposure concentrates, and the planner returns the portfolio that fits — with the timing trap and the verification you must fix before spending.
Planner result
Daytime surface peaks — cool surfaces first
0 of 5 verification items fixed.
Cool surfaces attack surface temperature and daytime peaks, and they ride resurfacing cycles — the cheapest entry point when the district’s heat is a daytime problem. Their performance decays without maintenance, so pair deployment with a reflectance programme rather than a one-off installation.
Targeting: no exposure flags are set yet — build the overlay (surface temperature, canopy cover, impervious share, elderly share, worker density, tenure) and let it set the sequence rather than the loudest district.
Timing trap: Deploy reflective systems across open expanses first; canopy still helps, but it cannot deliver by the next summer.
Verification: not yet fixed. Lock the classification, routes, sensor positions, health definitions and cadence before the first measurement, or the fifth year will not compare with the first.
Orientation aid only. This planner applies the diagnosis logic published on the article; it does not model temperatures, cost interventions, or replace a district heat study. © Nuvira Space. All rights reserved. | URBAN PULSE Series.
The urban system: what the layers must do
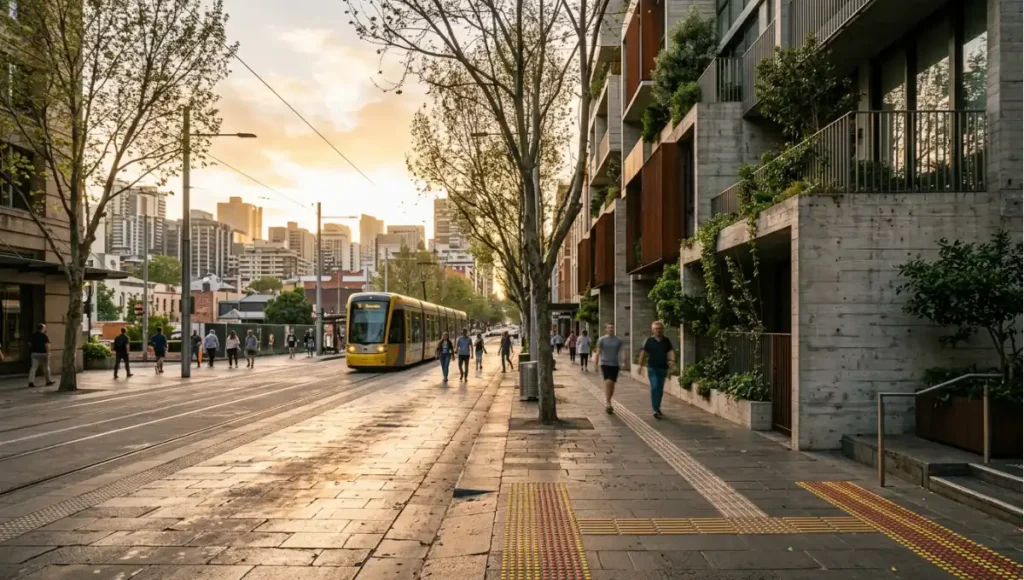
Heat is a whole-corridor condition, which is why single interventions underperform their models. Read the district at three layers — the mobility layer that moves people through the heat, the infrastructure layer that decides how much heat the fabric stores and releases, and the social layer that decides who can escape it — and the portfolio follows from the diagnosis rather than from the catalogue.
Transit-Oriented Development: the mobility layer
- The walk to the stop is the heat exposure most riders cannot avoid. Shade along routes, tree canopy at boarding points, and treated paving at stops are mobility infrastructure rather than amenity, because a corridor nobody can comfortably walk in summer is a corridor with a seasonal ridership hole.
- Route choice is a heat decision. Where the walk-shed offers a shaded path and an exposed one, the shaded path is the higher-capacity route; map shade as part of the network rather than leaving it to chance.
- Refuge is part of the journey. Cooling rooms near interchanges let riders break a trip during extreme heat, which is how a mobility network absorbs an event instead of failing during it.
- Night service and night heat move together. Evening heat retention coincides with evening travel and with vulnerable residents returning home; lighting, shade, and refuge hours belong to the same service design.
- Measurement belongs to the network. Ridership, comfort reports, and stop-level temperature belong in the corridor’s monitoring, so the mobility layer can be adapted as the climate moves.
Resilient Infrastructure
- Surfaces decide how much energy the day deposits. Reflective, evaporative, permeable, and phase-change systems each attack a different part of the energy balance, and each has a maintenance profile that decides whether its performance survives weathering.
- Canopy is infrastructure with a maturity timeline. Street trees deliver shade, evapotranspiration, and air-quality co-benefits, but they arrive over years — which is why plantings are sequenced first chronologically even when faster wins are delivered first politically.
- Blue-green systems cool by phase change and pay twice. Retention landscapes evaporate water while detaining stormwater, tying heat mitigation to the hydrology our sponge guide engineers.
- Canyon geometry sets the ceiling on late-night relief. Sky-view factor governs radiative release, so deep canyons stay warm regardless of surface treatment while open ground flushes after sunset — ventilation corridors and stepped heights are the tools that fit that geometry.
- Waste heat is an infrastructure externals problem. Traffic, plant, and industrial flux have to be controlled upstream of any corridor that claims to flush heat, or the corridor imports what it was built to export.
Sociological Urbanism
- Exposure follows historical disinvestment. Lower-canopy, higher-impervious districts with older and outdoor-working populations carry the steepest gradients — a pattern whose causes are social long before they are thermal.
- Warning without response capacity is weather commentary. Tiered alerts only mean something if refuge hours, transport to cooling sites, worker protections, and wellness checks are pre-funded and staffed.
- Availability collapses when it is needed most. Evening peaks, closed centres, and unlit routes reproduce the same gap in a different dimension — the temporal and mobility gaps our refuge coverage names.
- Maintenance is a stewardship question. Reflectance decays, canopy needs water, and detention needs clearing; the districts with the thinnest stewardship capacity are usually the hottest, which is why maintenance funding is an equity instrument.
- Target by exposure-weighted need, not by visibility. The overlay — surface temperature, canopy cover, impervious share, elderly share, worker density, tenure — sets the sequence, not the loudest district.
- Report tract-level outcomes annually. Publishing what happened where is what keeps a heat programme accountable to the residents the map identified.
The mitigation palette
Cool surfaces: reflective, evaporative/permeable, phase-change, and high-conductive pavement systems — engineered in our cool pavement guide, including the cost gap, visibility politics, and standards vacuum that stall deployment, plus maintenance programmes that sustain reflectance against weathering and soiling. Canopy geometry: street trees and vegetated corridors shade surfaces and restore evapotranspiration; species selection, maturity timelines, and corridor widths from our refuge-network coverage. Water bodies and blue-green systems: retention landscapes that cool by evaporation while managing stormwater — our sponge guide engineers the hydrology. Ventilation corridors: wind paths and canopy-vs-wind design choices that flush trapped heat. No single family suffices; portfolios combine by district diagnosis. And mind the standards vacuum our cool-pavement coverage documents — material certification and rating programmes lag deployment, so write performance specifications (reflectance retained after weathering, permeability maintained after loading, canopy survival past establishment) into procurement rather than waiting for labels to mature.
Mitigation strategies compared
| Strategy | Cools primarily | Lead time | Watch-out |
|---|---|---|---|
| Cool surfaces | Surface temperatures, daytime peaks | Resurfacing cycles | Reflectance decay without maintenance; glare review |
| Canopy corridors | Air + surface, day and evening | Years to maturity | Water demand; species survival |
| Blue-green systems | Air via evaporation; storm co-benefit | Project timelines | Standing-water and vector management |
| Ventilation corridors | Nighttime flushing | Planning horizons | Upwind source control required |
| Refuge networks | Human exposure during events | Retrofit pace | Coverage equity — see below |
Comparative analysis: heat-treated district vs unmanaged district
The comparison is not between technologies but between planning postures. An unmanaged district treats heat as weather and responds when an event arrives; a heat-treated district treats it as a measurable output of its own decisions and intervenes where the measurement says the harm is. Rows are directional, and the magnitudes live in each district’s own monitoring.

| Dimension | Conventional District | Urban Pulse District | Delta |
|---|---|---|---|
| Commute time | Shade is incidental; walking routes bake in summer and ridership thins exactly when the network is needed | Shade mapped as part of the walking network, canopy at stops and along routes, refuge near interchanges | Direction: summer walking is usable where routes are treated |
| Car dependency | Heat pushes people into cars for trips they would otherwise walk, adding load to the hottest surfaces | Treated walking and cycling routes keep non-car options viable through the season | Direction: fewer heat-forced car trips |
| Climate exposure | Surfaces absorb, canyons trap, and the district has no instrument to know how much | Surface, air, and health data combined; portfolio targeted by classification and verified against it | Direction: exposure becomes measurable and operable instead of assumed |
| Social interaction | Public realm empties in the heat; evening life migrates indoors behind closed windows | Shaded public space, evening refuge hours, and cooled public rooms keep the street in use | Direction: evening life continues through the hot season |
| Land value stability | Hot districts devalue by degrees, and the residents least able to move carry the exposure | Exposure-weighted investment plus maintenance funding where stewardship capacity is thinnest | Direction: value protected where intervention follows the map |
| Delivery speed | Emergency response on demand; nothing compounds between events | Slow growers sequenced first: plant now for shade in a decade, with quick wins layered on | Direction: capability accumulates rather than restarting each summer |
Case reference matrix
Three public programmes, read through the district lens. None is a Nuvira project, none is presented as one, and where a cell has no documented evidence in our coverage the cell says so.
| District/System | TOD Typology | Resilience Measure | Social Outcome |
|---|---|---|---|
| Medellín, Colombia — Green Corridors | Not a transit-typology programme; the documented instrument is a network of planted corridors along roads and waterways | Green corridors established along many roads and waterways, replacing hard surfaces with planted verges and shade — the C40 knowledge hub reports the programme reduced the urban heat island effect by around 2°C, and UNEP documents the corridor works | Publicly documented as a co-benefit programme — shade, air quality and amenity together; distributional outcomes beyond the corridor works are not documented in our coverage |
| Ahmedabad, India — Heat Action Plan | Not a transit-typology programme; the documented instrument is an institutional heat-response framework | Early-warning system and inter-agency coordination for predicted extreme heat, with the plan updated annually — documented by NRDC and the C40 knowledge hub as a framework covering implementation, coordination and evaluation | Explicitly framed as protecting the city’s most vulnerable residents from extreme-heat health impacts; programme-level health outcomes are reported by the city and its partners |
| Phoenix, United States — Office of Heat Response and Mitigation | Not a transit-typology programme; the documented instrument is an institutional office with a published response plan | A standing municipal office running both heat response (helping people cope during events) and heat mitigation (cooling the built environment), with a published annual heat response plan setting out its strategies and actions | Publicly documented as the institutional answer to being the hottest large city in the United States; tract-level distributional outcomes are not documented in our coverage |
The sequencing lesson sits across the three rows, and it is not about which technology wins. Medellín shows that a corridor programme can move a city-scale metric when the planting is treated as infrastructure rather than beautification. Ahmedabad shows that the response layer — warning, coordination, evaluation, annual revision — is an institution before it is an intervention. Phoenix shows the same insight in municipal form: heat gets a standing office with a published plan, because the alternative is rediscovering the problem every summer. In all three, the measurement discipline is what makes the claim testable — and in all three, the column our coverage documents least is who benefited most. That absence is a reminder rather than a gap in the programmes: distributional outcomes have to be measured deliberately, because they do not archive themselves.
Equity: exposure is not evenly distributed
Heat maps onto income, age, tenure, and historical redlining with brutal consistency — research literature frames UHI explicitly as a health-equity threat amplified by climate extremes. Lower-canopy, higher-impervious districts run hottest and cool slowest; elderly and outdoor-worker populations face the steepest health gradients. The planning consequence: target by exposure-weighted need, fund maintenance where stewardship capacity is thinnest, and measure outcomes in the hottest tracts first. Build the map from overlaid layers — surface temperature, canopy cover, impervious share, elderly share, outdoor-worker density, tenure mix — and let the overlay, not the loudest district, set the sequence. Historical disinvestment patterns predict today’s hotspots with depressing reliability; say so in the plan, fund accordingly, and report tract-level outcomes annually. Our refuge networks guide names the three equity gaps cities still miss — geographic proximity failure, temporal availability collapse, mobility-excluded access — as the audit to run before spending.
The measure → target → verify chain
Classify severity by district. Target portfolios to the classification — cool surfaces where daytime peaks dominate, canopy where evening retention rules, ventilation where canyons trap, refuges where people cannot wait for maturity timelines. Then verify against the same taxonomy: post-intervention traverses, sensor arrays, and health surveillance compared like-for-like with baseline. Publish the comparison either way — negative results discipline the next portfolio. Cooling that underperforms its model is data, not failure, provided the shortfall is documented, diagnosed against the classification, and priced into the next targeting round rather than buried. Performance indicators and funding mechanics from our refuge coverage complete the loop.
Reading the city thermally: sky view, mass, and timing
Two concepts predict where heat concentrates. Sky-view factor — how much sky a street surface sees — governs nocturnal radiative release: deep canyons cool slowly no matter the surface material, while open plazas flush heat after sunset. Thermal mass lag governs timing: heavy districts peak later and stay warm into evening hours when vulnerable residents are home. Map both before prescribing: canyon districts need ventilation and refuge coverage more than reflective resurfacing, while open asphalt expanses invert the priority. Diagnosis precedes prescription, always.
Cool surfaces, honestly assessed
Reflective systems cut surface peaks but demand maintenance — reflectivity decays with weathering and soiling, and pedestrian glare needs review in design, not after complaints. Evaporative and permeable systems cool through water phase change and need supply plus clogging management. None of this argues against cool surfaces; it argues for maintained ones with honest scope — daytime surface peaks, not whole-island erasure. Our cool pavement guide carries the four systems, cost-gap politics, and certification landscape in full.
Canopy and water: the slow growers
Trees are the highest co-benefit intervention — shade, evapotranspiration, air quality, amenity — and the slowest: plant for the maturity timeline, value the shade decades out, and water through establishment. Vegetated corridors double as the cool-corridor network our refuge coverage engineers, with widths, retrofit paths, and wind-versus-canopy choices. Water bodies add evaporative cooling plus storm proofing with vector and maintenance regimes. Sequence slow growers first chronologically even when quick wins deliver first politically.
Cool roofs and the nighttime danger window
Roofs deserve separate treatment from pavements: high-albedo membranes and coatings cut rooftop temperatures and top-floor cooling loads, with different maintenance and glare profiles than streets. And mind the clock — mass-lag shifts peak danger into evening hours in heavy districts, exactly when cooling centers close and vulnerable residents are home. Refuge networks exist for this window: coverage, hours, and mobility access must match the thermal reality, not office hours. Our refuge guide engineers that coverage.
Satellite mapping versus street truth
Satellites see surfaces, not sidewalks: land-surface temperature maps pattern brilliantly and mislead specifically — a shaded 40-degree surface with 25-degree air tells a different story than the pixel suggests. Pair every satellite layer with street truth: traverse campaigns on representative routes across diurnal cycles, fixed arrays at priority sites, and resident-reported comfort where sensors cannot go. Cost the street layer into every mapping budget; the satellite-only heat plan is a hypothesis wearing a heat map.
Heat-health warning and response
Measurement earns its keep during events. Tiered warning systems — advisory, watch, emergency — trigger pre-planned responses: extended refuge hours, transit fare relief to cooling sites, outdoor-worker protections, wellness checks on registries of vulnerable residents. Warnings without response capacity are weather commentary; build the response inventory (sites, transport, staffing, communications in all locally spoken languages) before the season, and exercise it in spring. After-action review against the same taxonomy feeds next year’s targeting.
Ventilation design: flushing the canyons
Where canyons trap heat, design airflow: align primary ventilation corridors with prevailing night winds, step building heights to drive pressure differentials, and choose canopy-versus-wind configurations per corridor purpose — wind corridors for flushing, canopy corridors for shading, hybrids where both matter. Upwind source control is prerequisite: a ventilation corridor downwind of waste heat or traffic exhaust imports the problem it was built to export. Model before committing concrete; wind does not respect diagrams.
Monitoring that closes the loop
Verification infrastructure is part of the intervention, not an accessory: fixed arrays for continuous record, traverse campaigns for spatial detail, satellite passes for pattern context, health surveillance for outcome weighting. Re-measure on the same taxonomy and cadence as baseline — seasonal and diurnal matching, not convenient sampling. A summer-afternoon resurvey compared against a spring-morning baseline proves nothing but the calendar; lock traverse routes, sensor positions, satellite overpass windows, and health-data definitions before the first measurement so the fifth year still compares with the first. Specify the monitoring regime in the same decision that funds the mitigation; retrofitted evaluation inherits incompatible baselines. Our refuge coverage details KPIs and funding mechanics that transfer directly.
Part of our urban systems guide — the field guide to resilient urbanism.
Speculative / Internal Concept Study — Northwind Terrace — by Nuvira Space
Everything in this section is a speculative internal concept study. It is not a built project, it has no client, and every quantity below is a modelled concept target used to make the reasoning concrete — never a measured result.
Project overview
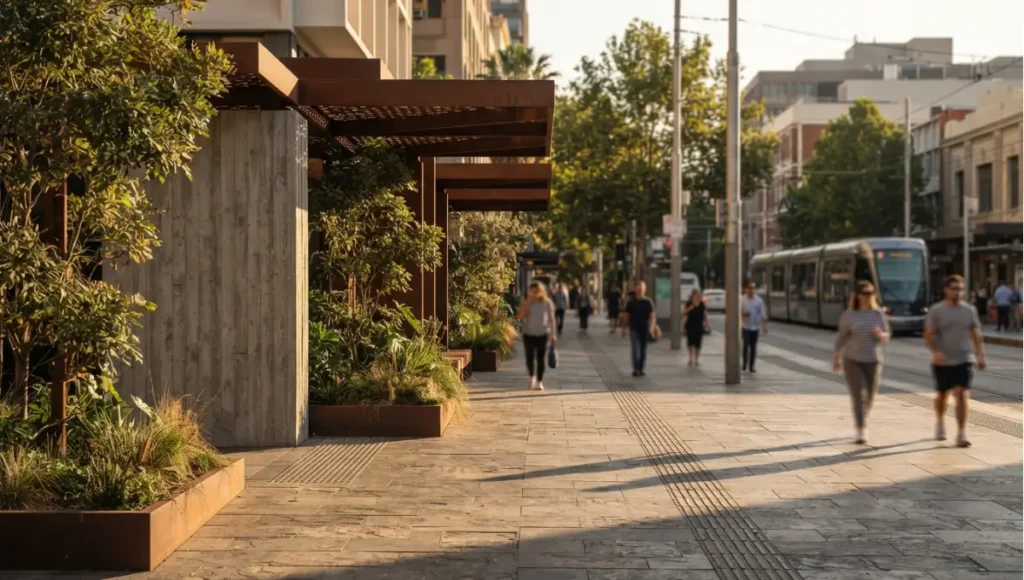
Northwind Terrace is a speculative heat-mitigation study for an existing low-rise residential district in a city with hot, still summers: deep street canyons of three- and four-storey blocks, almost no canopy, dark asphalt throughout, and an older population living in homes with limited cooling. The typology is the retrofit case — no greenfield, no demolition — layered on top of a street-reconstruction programme the city had already funded. Scale in the concept model: a district-wide treatment in three phases tied to resurfacing cycles, with a 2030+ completion horizon and monitoring specified in the same decision that funds the first phase.
Design levers applied
- Diagnosis before prescription: the district is classified first — daytime surface peaks, evening retention, canyon trapping, and refuge shortfall each scored separately — so the portfolio follows the diagnosis rather than the catalogue (concept target, not a measured result).
- Ventilation corridors aligned to prevailing night winds, with canopy kept low and clear along the primary flushing routes so shade does not purchase evening heat (concept target, not a measured result).
- Canopy planted in the 800m-scale walk-shed first, sequenced chronologically ahead of resurfacing so the slowest intervention starts earliest, with irrigation through establishment funded from the same budget (concept target, not a measured result).
- Cool surfaces deployed only where daytime peaks dominate — reflective systems retained for open expanses, evaporative and permeable systems where water supply and maintenance regimes already exist (concept target, not a measured result).
- Refuge coverage matched to the evening window, with cooling rooms open when mass-lag pushes peak danger past centre-closing hours, and transport to them planned rather than assumed (concept target, not a measured result).
- The verification taxonomy fixed at funding: traverse routes, sensor positions, satellite windows, and health-data definitions locked before the first intervention so year five still compares with year one (concept target, not a measured result).
Transferable takeaway
Take the sequence, not the planting plan: classify the district, align ventilation before applying shade, plant the slow growers first, deploy surfaces only where the diagnosis supports them, open the refuges when the heat actually peaks, and fix the measurement taxonomy in the same budget that funds the work. Any city can run that ordering against the district it already has — and the ordering costs nothing but the discipline to hold it.
2030 and beyond
Expect heat classification embedded in planning approvals, cooling performance specified like structural performance, and exposure-weighted funding as standard practice. The cities that start measuring this decade will spend the next one mitigating with precision; the rest will spend it on emergency response. Directional scenarios; timelines are local politics.
Frequently asked questions
Q: What causes the urban heat island effect?
A: Dark impervious surfaces, lost evapotranspiration, canyon heat trapping, and anthropogenic waste heat — stacking most visibly in nighttime temperatures.
Q: How is heat island severity measured?
A: Urban–rural differentials stratified by surface/air and day/night, via satellite mapping confirmed by street-level sensing and weighted by health outcomes.
Q: Do cool pavements actually work?
A: Yes within their scope — surface and daytime-peak reduction — sustained only with maintenance against reflectance decay; full systems detail in our cool pavement guide.
Q: Trees versus reflective surfaces: which first?
A: Canopy where evening retention and co-benefits dominate; surfaces where daytime peaks and resurfacing cycles align. Diagnose by district, combine by portfolio.
Q: Who is most affected by urban heat?
A: Elderly residents, outdoor workers, and lower-income districts with sparse canopy and high impervious cover — target by exposure-weighted need.
Q: How fast can a city cool down?
A: Refuge networks at retrofit pace; surfaces on resurfacing cycles; canopy on maturity timelines of years. Sequence quick wins with slow growers.
Q: Do green roofs mitigate the heat island?
A: At roof and near-field scale, yes — evapotranspiration plus insulation value — with structural loading and irrigation as the governing constraints. District-scale cooling still needs corridors, canopy, and surfaces; roofs are a valuable layer, not a strategy alone.
Q: How do cities pay for heat mitigation?
A: Resurfacing cycles, park capital, stormwater utilities, development levies, and health-system co-investment where avoided illness is priced — see the funding mechanics in our refuge networks guide.
Tune into the Urban Pulse archive
Tune into the Urban Pulse archive → nuviraspace.com/urban-pulse — heat, sponge, mobility, and night-economy coverage added as the systems evolve.
Heat mitigation directory
Refuge delivery: heat refuge networks. Surface systems: cool pavement guide. Hydrology: sponge cities.
© Nuvira Space. All rights reserved. | URBAN PULSE Series | All specifications cited are based on publicly available research. Northwind Terrace is a speculative internal concept study and does not represent a completed project.