

Table of Contents
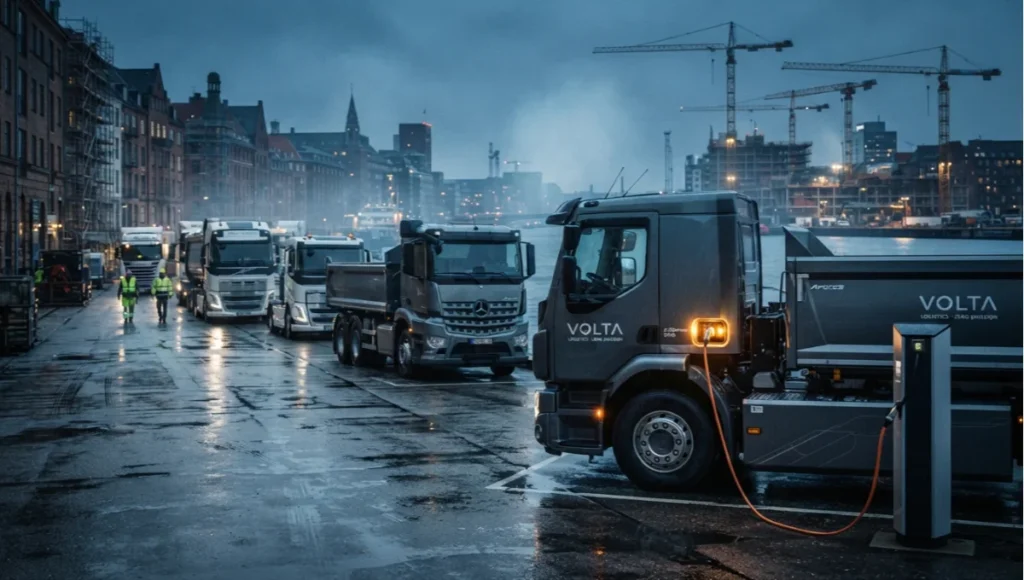
A zero emission construction logistics rollout rarely fails on the yard. It fails in the render queue, six weeks before the first electric truck ever crosses a gate. Procurement teams commit to battery-electric fleets, hydrogen fuel cells, and consolidated micro-hub deliveries based on animations that were never built to hold up to scrutiny — flat lighting, guessed material response, and traffic simulations that treat a construction corridor like an empty parking lot.
The gap between what a stakeholder sees in a pitch deck and what actually happens when forty-ton mixers share a lane with cargo bikes is where zero emission construction logistics programs quietly lose their budget approval, their community buy-in, or both.
Nuvira Perspective
At Nuvira Space, we treat the render as a load-bearing part of the project, not a decorative afterthought stitched on at the end of a schematic phase. Real-time engines and high-fidelity simulation are no longer presentation tools — they are the connective tissue between digital intent and architectural reality, particularly on logistics-heavy briefs where the actual performance of a system (routing, charging cadence, noise footprint, dust dispersion) has to be legible to people who will never open a CAD file.
This is human-machine synthesis in the literal sense: a visualization pipeline where the machine’s photometric accuracy and the human eye’s trained skepticism are both doing verification work. When a global illumination pass correctly bounces late-afternoon light off a wet asphalt staging yard, and a reviewing engineer can still point at a shadow and say ‘that’s wrong, the gantry crane occludes differently,’ the tool has done its job. It has made the model arguable. Zero emission construction logistics, as a category, needs more arguable models and fewer glossy ones.
This guide walks through the production pipeline we use to visualize five zero emission logistics strategies — electrified fleet staging, consolidated micro-hub delivery, dynamic charge scheduling, low-carbon last-mile transfer, and telematics-driven route compression — with the rendering discipline of a pro-to-pro workflow rather than a marketing reel.
Step-by-Step Workflow & Features
Stage One: Data Ingestion and Scene Assembly
Every logistics visualization begins as a data problem before it becomes a lighting problem. We import site topography, GIS boundary data, and fleet telemetry schemas directly into the scene graph so that vehicle placement, turning radii, and dwell times are driven by real operational constraints rather than an artist’s eyeball estimate.
- Georeferenced site mesh imported at true scale, tolerance held to ±2 cm per 10 m span
- Fleet assets rigged with correct axle counts, turning radii, and charge-port locations per OEM spec sheets
- Telemetry-driven animation curves for dwell time, queueing, and route timing pulled from logistics simulation exports (CSV/JSON)
- Scene split into staging yard, transit corridor, and delivery-point sublayers for independent lighting control
This ingestion discipline matters more than it seems on first read. A logistics scene that starts from an artist’s rough approximation of where a mixer truck should sit will drift further from the operational plan with every revision, because there is no ground truth to reconcile against. By binding vehicle placement to the same telemetry schema the fleet operations team already uses for dispatch, we remove an entire category of dispute from stakeholder review: nobody has to argue about whether the truck is roughly in the right place, because its position is a direct read from the same data source driving the actual logistics plan.
We also maintain a strict separation between authoring geometry (the site mesh, the fixed infrastructure, the permanent charging stations) and simulation-driven geometry (the vehicles, the queue lines, the transient stockpiles). Authoring geometry is modeled once and locked; simulation-driven geometry is re-imported on every data refresh. This split means a lighting change late in production never risks corrupting the underlying operational accuracy of the scene, and a logistics data update never forces a full relight.
Stage Two: Global Illumination and Lighting Fidelity
Construction logistics scenes are punishing on a lighting engine because they mix hard industrial surfaces — steel, wet concrete, painted signage — with soft atmospheric conditions like dust haze and diesel-to-electric transition smoke (or, ideally, its absence). We run multi-bounce global illumination at a minimum of six light bounces for exterior yard scenes, and we always validate against a real-world sky model rather than a synthetic HDRI pulled from a generic library.
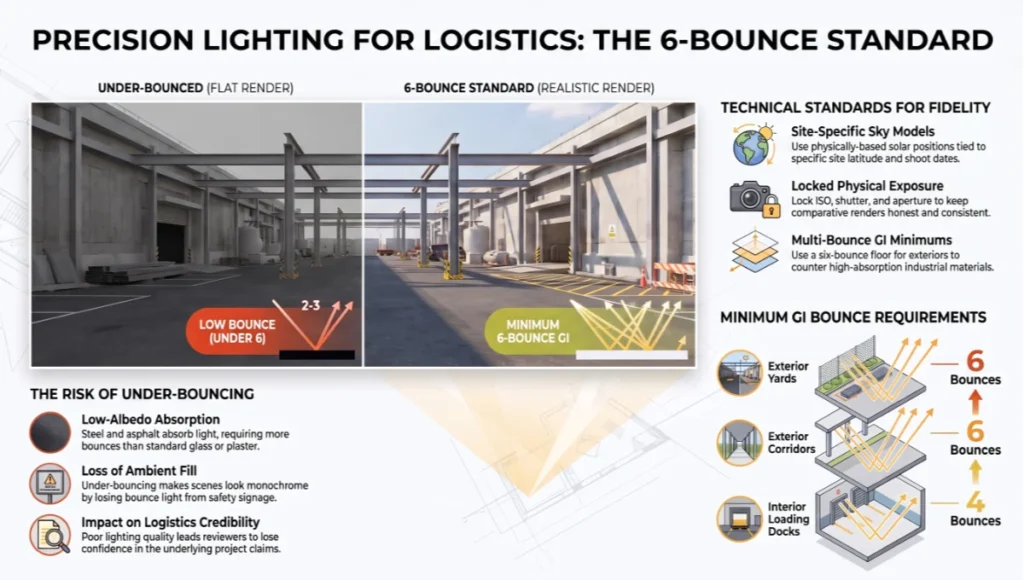
- Physically-based sky model tied to true solar position for the site’s latitude and shoot date
- Minimum six-bounce GI for exterior yard and corridor scenes; four-bounce floor for interior loading dock renders
- Volumetric fog/dust density authored per site type — dry aggregate yard vs. wet coastal corridor
- Exposure locked to a physical camera model (ISO, shutter, aperture) rather than auto-exposure, to keep comparative renders honest
The six-bounce floor is not an arbitrary house style. Construction yards are full of large, low-albedo surfaces — raw concrete, asphalt, unpainted steel — that absorb far more light per bounce than the glass-and-plaster interiors most GI settings are tuned for by default. Under-bouncing this kind of scene produces a specific, recognizable failure mode: shadowed areas read as flat and slightly too dark, and colored bounce light from high-visibility signage or safety coatings never makes it into the ambient fill, so the whole yard looks slightly more monochrome than it would in person. Reviewers may not name the defect, but they register the scene as off, and that impression bleeds into their confidence in the underlying logistics claim.
Stage Three: Ray-Tracing Parameters for Fleet and Material Accuracy
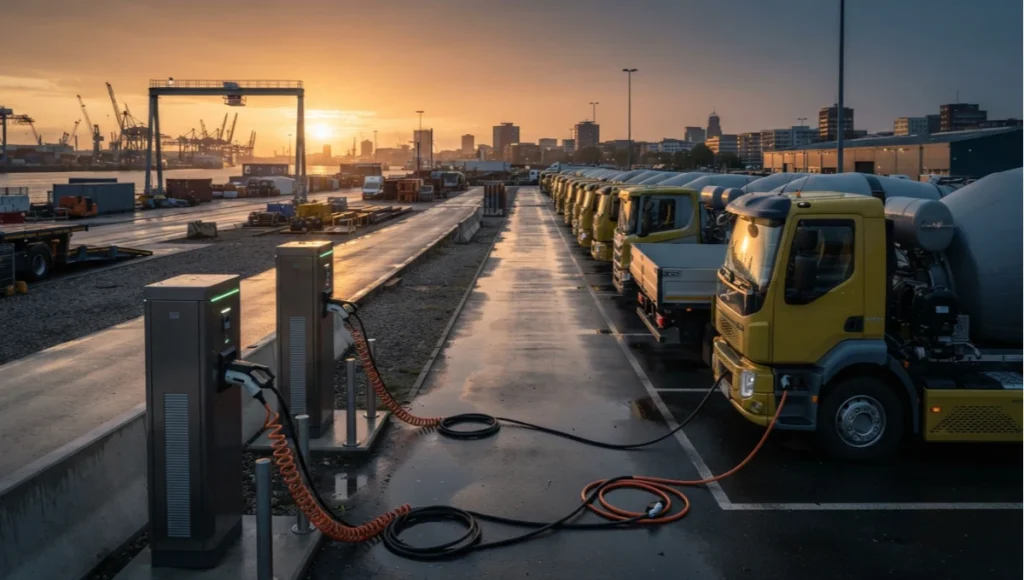
Electrified fleet assets read as fake almost immediately if the paint, glass, and undercarriage shading are wrong — viewers may not know why a render looks synthetic, but they feel it. We tune ray-tracing parameters specifically for the reflective and semi-reflective surfaces that dominate a logistics yard: cab glass, battery housing composites, high-visibility coatings, and wet ground planes.
Core ray-tracing settings we standardize on
- Reflection bounce depth: 8+ for glass-heavy cab interiors, 4 for general yard geometry
- Clearcoat layer modeled separately from base paint on all fleet assets to capture correct fresnel falloff
- Subsurface scattering enabled on high-visibility vest and signage materials for correct daylight legibility
- Denoiser threshold tuned per shot rather than globally, to avoid smearing fine detail on charging cable bundles and connector housings
Battery housing composites in particular deserve individual attention. Most off-the-shelf material libraries treat them as a generic matte plastic, which reads as noticeably cheaper than the anodized aluminum and painted steel surrounding them on a real fleet asset. We build a dedicated layered material — clearcoat over a textured base, with a subtle anisotropic component along the housing’s machined grain — because this is exactly the kind of surface a fleet operator will glance at first, since it’s the visible signal that the vehicle in the render is the specific electrified model they’ve budgeted for, not a generic stand-in.
Stage Four: Post-Production Compositing
The composite pass is where a technically correct render becomes a communicable one. We separate render passes — diffuse, specular, ambient occlusion, cryptomatte ID mattes — so that stakeholder-specific overlays (route lines, noise contours, emissions deltas) can be added without re-rendering the base scene.
- Cryptomatte ID mattes generated per fleet asset for isolated color grading and overlay work
- Route and charge-corridor overlays composited as a separate data layer, toggleable for different stakeholder audiences
- Color grade held to a narrow LUT range to prevent the scene from reading as more finished or optimistic than the underlying data supports
One discipline we hold firmly in the composite stage: overlays never touch the base render’s exposure or white balance. It’s tempting to punch up contrast when adding a bright green zero emission corridor overlay line so it reads clearly against the plate, but doing so quietly shifts how the whole scene is perceived, usually toward a warmer, more optimistic grade than the lighting pass earned. Overlays are composited in a separate layer group with their own blend mode, locked away from the base color grade, specifically so a reviewer’s read of the environment stays anchored to the physically-based lighting pass underneath it.
Comparative Analysis: Nuvira Vs. Industry Standard
Rendering Pipeline Depth
Most logistics visualization work in this space is still produced in real-time game engines configured for architectural walkthroughs, not fleet-heavy industrial choreography. The industry standard default is a single-bounce or two-bounce lighting approximation with baked lightmaps, which is fast but collapses under scrutiny the moment a reviewer asks about a specific time of day or weather condition. Our pipeline holds a minimum six-bounce GI standard on exterior work specifically because logistics stakeholders — permitting bodies, community boards, fleet operators — ask exactly those questions.
Data Fidelity vs. Artistic License
Industry-standard logistics renders frequently treat vehicle placement and route timing as an art-directed choice: trucks are placed where they look good, not where the telemetry says they will be. Nuvira’s pipeline inverts that relationship, the same way autonomous coordination between machines is starting to replace hand-sequenced site operations more broadly. Vehicle position, dwell time, and queue length are animation-driven outputs of the underlying logistics simulation, and the art direction — camera angle, time of day, lens choice — is layered on top of data that hasn’t been altered to flatter the outcome.
Turnaround and Iteration Cost
A common industry criticism of high-fidelity, multi-bounce GI work is turnaround time. We manage this with the sublayer split described in Stage One: staging yard, corridor, and delivery-point layers render independently, so a stakeholder note on corridor lighting doesn’t force a full-scene re-render. In practice this keeps iteration cycles inside a standard sprint rather than pushing a logistics visualization deliverable into a second billing cycle.
Overlay Flexibility
Industry-standard delivery is usually a single baked video file, with any change to the data overlay requiring a full re-export from the source engine. Because our overlays live as an isolated compositing layer rather than a baked-in element of the render, a client can request a different tariff window on the charge-scheduling overlay, or a different emissions baseline for comparison, and receive an updated deliverable without touching the underlying lighting or geometry. This single difference in pipeline architecture accounts for a large share of the revision requests that would otherwise require a full re-render cycle under a conventional workflow.
Accountability of the Final Frame
Perhaps the most consequential difference is procedural rather than technical. Every Nuvira logistics render ships with a data provenance note attached to the delivery — which telemetry export, which date range, which fleet configuration the scene reflects.
This mirrors the reporting discipline architects are increasingly expected to bring to embodied carbon accounting, where a case study by the American Institute of Architects and a U.S. Department of Energy reference guide both found that traceable, data-backed claims consistently outperform generalized sustainability messaging in stakeholder trust. It changes the incentive structure of the work: a render that can be traced back to a specific data snapshot is much harder to quietly touch up in ways that flatter the underlying logistics claim, because any divergence between the scene and its cited data source becomes a documented discrepancy rather than an invisible one.
Concept Project Spotlight: Speculative / Internal Concept Study — The Rotterdam Corridor Twin by Nuvira Space
Project Overview (Location / Typology / Vision)
Location: Rotterdam, Netherlands — Maasvlakte-adjacent construction corridor serving a mixed-use port redevelopment.
Typology: Digital twin of a zero emission construction logistics corridor, covering a staging yard, a 1.4 km transit lane, and two delivery points at active build sites.
Vision: Rotterdam’s port authority and municipal planners have pushed aggressively toward low-carbon freight movement, and the city’s dense mix of waterway, rail, and road logistics makes it a useful stress test for a zero emission construction logistics visualization: narrow lanes, tidal light conditions, and heavy multimodal traffic all compress into a few hundred meters of corridor.
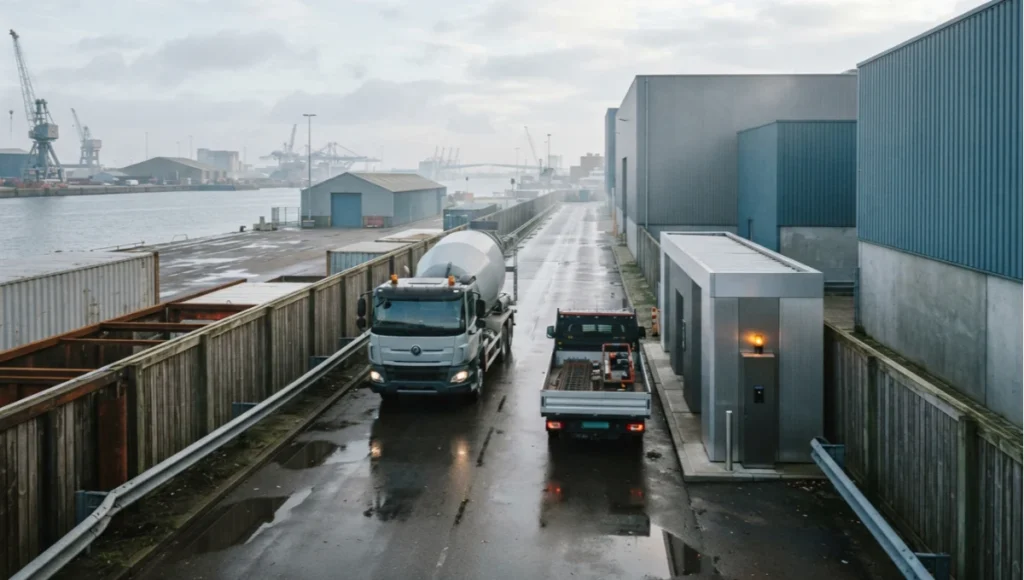
The corridor was chosen internally, rather than commissioned by a client, precisely because it presents worst-case visualization conditions in a compact footprint. A single Rotterdam corridor scene forces the pipeline to handle low, glancing winter sun; reflective wet asphalt for a large share of the calendar year; and a fleet mix that includes both heavy mixers and lighter electric flatbeds sharing the same lane geometry. If the lighting and material pipeline holds up here, it holds up on drier, higher-sun-angle sites with far less adjustment.
Design Levers Applied
Fleet and routing levers
- Battery-electric mixer and flatbed fleet substituted for diesel baseline, with charge-port geometry modeled to true OEM spec
- Micro-hub consolidation point placed 900 m from the primary site to cut last-mile diesel cargo-bike-adjacent transfer distance
- Dynamic charge scheduling window layered as a data overlay, showing overnight low-tariff charging against daytime dwell-charging opportunities
Visualization levers
- Tidal daylight model tuned to Rotterdam’s specific latitude and North Sea atmospheric haze profile
- Wet-asphalt material response calibrated against reference photography shot in comparable North Sea port conditions
- Noise-contour data layer composited over the corridor render to visualize community-facing acoustic impact of the electrified fleet vs. the diesel baseline
Transferable Takeaway
The Rotterdam Corridor Twin demonstrates a principle that holds regardless of city: a zero emission construction logistics render only earns trust when its lighting, material, and routing decisions are all traceable back to a real constraint — a tide table, an OEM charge-port dimension, a tariff schedule. Any team adapting this workflow to a different city should treat the local light and local grid tariff structure as first-class inputs, not stylistic flourishes.
A useful test for any team porting this workflow elsewhere: pick the single most punishing local condition (glare off a desert staging yard at midday, monsoon-season haze, extreme winter darkness at high latitude) and build the reference lighting rig around that condition first, not around the most photogenic weather the site experiences. Singapore’s near-constant high humidity and near-vertical midday sun angle, for instance, would demand an entirely different volumetric and specular setup than Rotterdam’s low winter sun and wet asphalt, even though the underlying zero emission fleet logic is identical.
Intellectual Honesty: Hardware Check
Six-bounce global illumination on a full logistics corridor scene is not a laptop-friendly workload. A production-grade pass at 4K, with the fleet asset density described above, realistically needs a workstation-class GPU with 24 GB or more of VRAM to hold texture and geometry caches without falling back to system memory swapping, which will silently degrade denoiser performance without throwing an error.
Teams attempting this pipeline on consumer-tier hardware should expect to drop bounce count to four for iteration passes and reserve six-bounce renders for final delivery frames only. Real-time preview inside the engine viewport will also read noisier than the final offline render — do not judge lighting decisions from the live viewport alone; commit to a low-sample offline test render before signing off on a lighting setup.
Denoising is not a substitute for adequate sample count. A denoiser tuned to hide noise from an under-sampled render will also smear the fine geometric detail on charging cables, connector housings, and high-visibility trim — precisely the details a fleet-electrification story depends on for credibility.
Storage is the other quietly expensive line item. A full corridor scene with cryptomatte passes, per-asset ID mattes, and an EXR archival sequence for a ninety-second fly-through can easily exceed several hundred gigabytes before compression. Teams budgeting hardware for this pipeline for the first time consistently under-provision storage relative to GPU compute, and end up bottlenecked on disk I/O during the compositing stage rather than during the render itself.
2030 Future Projection
By 2030, we expect logistics-grade visualization to run substantially in real time rather than offline, as hardware-accelerated ray tracing closes the gap with today’s offline path-tracers. The practical effect for zero emission construction logistics work is that stakeholder review sessions will move from pre-rendered walkthroughs to live, steerable scenes where a permitting officer can ask to see the corridor at 7 a.m. in November and get an answer in seconds rather than a re-render request.
We also expect telemetry-to-render pipelines to tighten further, with live fleet GPS and charge-state data feeding directly into a visualization layer used for ongoing public reporting, not just pre-construction pitches. A city like Copenhagen, which already publishes granular freight and emissions data, is a plausible early adopter of this always-on visualization model.
The unresolved challenge through 2030 will remain human judgment: no amount of real-time ray tracing replaces a reviewer who knows what a wet asphalt yard actually looks like at dawn. Visualization tooling will keep getting faster; the discipline of checking it against reality has to keep pace.
We also anticipate a shift in who commissions this kind of visualization work in the first place. Today, most logistics visualization is requested late, by a communications or permitting team trying to build public support after the operational plan is already fixed. By 2030, we expect fleet electrification and micro-hub siting decisions themselves to be made inside a visualization environment, with planners adjusting charge-port count or micro-hub placement directly in a live scene and watching queue lengths and dwell times update in response, rather than receiving a rendered summary of a decision made elsewhere.
This earlier involvement changes the skill profile the role demands. A visualization artist working this way in 2030 will need working fluency in the underlying logistics simulation logic, not just the rendering engine, because the render becomes a live interface into the planning process rather than a report on its output.
Secret Techniques: Advanced User Guide
A handful of techniques separate a merely accurate logistics render from one that actually persuades a skeptical stakeholder.
- Light a scene for the reviewer’s worst-case condition first (overcast, low sun angle), not the most flattering one — if it holds up in flat light, it holds up everywhere
- Build a “diesel ghost” pass — a semi-transparent overlay of the legacy diesel fleet in the same frame as the electrified fleet, so the comparison is spatial, not just numerical
- Author acoustic and emissions data overlays as toggle layers rather than baked-in text, so a single render serves community boards, permitting officers, and internal engineering review without re-cutting the deliverable
- Cross-check GI bounce settings against a single real reference photograph of comparable material and weather conditions before committing to a final lighting rig
- Keep camera focal length consistent with the intended viewing distance of the final deliverable — wide lenses exaggerate scale in ways that undercut credibility on a technical logistics review
A less obvious technique: stage the diesel ghost comparison from Secret Techniques above at the exact same camera position and time of day as the electrified-fleet hero shot, and deliver both frames side by side rather than sequentially. Reviewers comparing two frames placed next to each other catch subtle inconsistencies — a shadow that doesn’t match, a queue length that’s suspiciously shorter in the after frame — that get missed when the same two images are shown thirty seconds apart in a walkthrough video. If a comparison can’t survive being placed side by side, it shouldn’t be shipped.
- Render a low-light or night-cycle pass even when it isn’t requested — charging infrastructure and safety lighting are often the most emissions-relevant part of a zero emission fleet story, and daytime-only deliverables routinely omit it
- Log the exact GI bounce count, sample count, and denoiser settings used for each delivered frame in the file metadata, so a later revision request can reproduce the original lighting conditions exactly rather than approximating them
Comprehensive Technical FAQ
Rendering and Pipeline Questions
Q: What global illumination bounce count is appropriate for an interior loading-dock render?
A: A four-bounce floor is typically sufficient for interior dock scenes, where light transport distances are short and surfaces are less varied than an open yard.
Q: Can real-time engine previews be used as final delivery frames?
A: They can for internal review, but final stakeholder-facing frames should be committed through an offline or hardware-accelerated path-tracing pass at full sample count to avoid denoiser artifacts on fine detail.
Q: How should fleet telemetry data be brought into the scene?
A: Export dwell time, route timing, and queue length from the logistics simulation as CSV or JSON and drive animation curves directly from that data, rather than hand-keyframing vehicle movement.
Q: What is the recommended way to handle scene updates when a fleet spec changes mid-project?
A: Keep simulation-driven geometry and authoring geometry in separate scene layers, as described in Stage One, so a fleet asset swap only requires re-importing the affected layer rather than rebuilding the full scene.
Q: How do you avoid a render looking more polished than the underlying data supports?
A: Lock the color grade to a narrow LUT range, keep overlays in an isolated compositing layer with their own blend mode, and always test the lighting rig against the site’s worst-case weather condition rather than its most flattering one.
Zero Emission Logistics Questions
Q: Do micro-hub consolidation points need to be visualized at true scale relative to the primary site?
A: Yes — relative distance between a micro-hub and the primary site directly affects last-mile routing legibility, and compressing that distance for framing purposes misrepresents the strategy.
Q: How is dynamic charge scheduling typically represented in a render?
A: As a toggleable data overlay showing tariff windows and fleet charge-state over a 24-hour cycle, layered on top of the base scene rather than baked into the lighting.
Q: Should noise and emissions overlays use the same color scale across every project?
A: No — scale each overlay to the specific site’s baseline and reduction target, since a fixed universal scale can make a genuinely strong result look unremarkable, or a modest one look overstated.
Q: How far in advance of a permitting hearing should a corridor visualization be finalized?
A: Aim for at least three sprint cycles before the hearing date, so the layered rendering pipeline has room for at least two rounds of stakeholder-driven overlay or lighting revision without compressing the final QA pass.
Q: What is the biggest visual tell that a logistics render is using placeholder rather than telemetry-driven vehicle placement?
A: Perfectly even spacing between vehicles in a queue. Real dwell and queue behavior produces irregular spacing driven by loading time variance, and a suspiciously uniform queue is usually a sign the scene was hand-placed rather than data-driven.
- Minimum recommended render resolution for stakeholder review: 4K, 16:9
- Recommended frame rate for animated fly-throughs: 30 fps minimum, 60 fps for interactive real-time review
- Recommended file delivery format: high-bitrate H.265 for review, EXR sequence for archival and re-grading
Build Your Zero Emission Logistics Twin With Nuvira Space
If your team is preparing a zero emission construction logistics rollout and needs a visualization partner who treats the render as evidence rather than decoration, Nuvira Space’s Visual Lab can build the corridor twin, fleet asset library, and stakeholder overlay system described in this guide around your specific site data.
Reach out to start with a scoped pilot render of your primary staging yard before committing to a full corridor build.
A pilot scoped to a single yard typically takes one sprint cycle to reach a stakeholder-ready first draft, and gives your team a concrete basis for deciding whether the full corridor treatment — telemetry-driven fleet placement, six-bounce GI, layered overlay compositing — is worth extending across the rest of the site before a permitting deadline forces the decision.
© Nuvira Space — All rights reserved. | THE VISUAL LAB Series | All specifications cited are based on internal Nuvira Space production standards and publicly available OEM and municipal data (no links). The Rotterdam Corridor Twin is a speculative internal concept study and does not represent a completed project.