

Table of Contents
Net-positive building data is no longer a theoretical benchmark — it is the measurable proof that your building produces more energy, sequesters more carbon, and cycles more water than it consumes across its operational lifetime. As of 2025, the built environment accounts for 39% of global CO₂ emissions, with operational energy responsible for 28% and embodied carbon in materials claiming the remaining 11%. These are not abstract statistics. They represent 13.7 billion tonnes of CO₂ annually — a figure that climate scientists at the Intergovernmental Panel on Climate Change (IPCC) identify as the single largest sectoral barrier to limiting global warming to 1.5°C above pre-industrial levels. The architecture profession cannot afford to treat this data as background noise.
Rotterdam — a city that has reimagined its entire urban waterfront as a regenerative infrastructure testbed — now mandates that all municipal buildings achieve a net-energy surplus of at least 15% above demand, verified through real-time sensor arrays embedded in 94% of its public building stock. That 15% surplus does not represent a symbolic gesture. It means that every 10,000 m² municipal office tower in Rotterdam generates approximately 150,000 kWh annually beyond what its occupants consume — enough to power 45 Dutch residential units for a full year from a single commercial asset.
Nuvira Space: Measuring What Matters
At Nuvira Space, we reject the architectural culture of performance theater — the LEED plaques mounted in lobbies of buildings that still draw 280 kWh/m²/year from fossil-fuel grids. Our editorial position is grounded in a core principle: every specification you read in this series has been cross-referenced against peer-reviewed lifecycle assessment (LCA) databases, including the ICE (Inventory of Carbon and Energy) v3.0 database from the University of Bath, the Ecoinvent 3.9 database, and the U.S. Department of Energy’s EnergyPlus simulation records. Net-positive building data is not a marketing language. It is a performance covenant between a structure and the environment that hosts it.
What you will find in this analysis is not a checklist of certification credits. You will find the hard numbers that determine whether a building is genuinely returning resources to the grid, the watershed, and the atmosphere — or merely consuming them more politely. That distinction is the entire architecture of the carbon-negative transition.
Technical Deep Dive: Reading Net-Positive Building Data
Energy: The Primary Performance Axis
The foundational metric in net-positive building data is the Site Energy Use Intensity (EUI), expressed in kBtu/ft²/year or kWh/m²/year. A baseline commercial office building in the United States operates at approximately 195 kBtu/ft²/year. A certified LEED Platinum building typically achieves 100–120 kBtu/ft²/year. A net-zero energy building targets 0 kBtu/ft²/year of net grid draw. A net-positive energy building — the structural category this analysis addresses — operates at a negative EUI: it pushes more energy to the grid than it draws, expressed as a surplus figure.
Documented Net-Positive Energy Performance Benchmarks
- Bullitt Center, Seattle (2013): EUI of −14.4 kBtu/ft²/year — the first occupied urban office building to export more energy than it imports, generating 240,000 kWh/year from a 575 kW rooftop photovoltaic array across 52,000 ft² of conditioned floor area
- Edge Olympic, Amsterdam (2016): Smart sensor density of 28,000 sensors across 40,000 m², achieving a certified EUI of 0 kWh/m²/year operationally, with a 70% reduction in energy use vs. conventional Dutch office stock
- Powerhouse Brattørkaia, Trondheim (2019): Net-positive energy office tower generating 485,000 kWh/year surplus from 3,000 m² of building-integrated photovoltaics (BIPV) on facades and roof, operating at 62° latitude with average solar irradiance of 957 kWh/m²/year
You can examine how building-integrated photovoltaics perform across climates in greater depth through Nuvira’s analysis of building integrated photovoltaics facade systems — a resource that maps facade angle, panel efficiency, and grid-export capacity across 12 climate zones.
Embodied Carbon: The Data Behind the Material
Operational energy performance alone does not determine net-positive status. Embodied carbon — the CO₂ emitted during material extraction, manufacture, transport, and construction — constitutes a front-loaded carbon debt that the building must repay through operational surplus over its service life. The AIA (American Institute of Architects) 2030 Commitment reports that embodied carbon now represents 28–38% of a new building’s total lifecycle carbon footprint, a proportion that rises to 50–80% in highly efficient operational buildings where the energy performance is excellent but the construction materials were carbon-intensive.
Material Embodied Carbon Factors (Global Warming Potential, kgCO₂e per kg)
- Structural steel (virgin): 1.46–2.89 kgCO₂e/kg (ICE v3.0)
- Reinforced concrete (35 MPa): 0.138 kgCO₂e/kg; rises to 0.208 kgCO₂e/kg with standard rebar density of 150 kg/m³
- Cross-laminated timber (CLT): −0.51 to −0.88 kgCO₂e/kg — carbon-negative at the material level due to biogenic carbon sequestration during timber growth phase
- Hempcrete (hemp + lime binder): −0.72 kgCO₂e/kg, with a density of 275–450 kg/m³ giving a wall panel a net sequestration of 108–198 kgCO₂e/m³ at 400mm depth
- Recycled aluminium (post-consumer): 0.55 kgCO₂e/kg vs. 11.5 kgCO₂e/kg for primary aluminium — a 95.2% embodied carbon reduction through circular sourcing
The transition from conventional concrete to CLT or hempcrete is not an aesthetic choice — it is a structural carbon arbitrage. For a 5,000 m² mid-rise building, replacing a reinforced concrete frame (approximately 800 tonnes of concrete + 120 tonnes of rebar) with CLT structural panels shifts the embodied carbon from +165,600 kgCO₂e to −306,000 kgCO₂e: a swing of 471,600 kgCO₂e, equivalent to removing 102 passenger vehicles from the road for 1 year. Read Nuvira’s detailed comparison of cross-laminated timber vs mass timber for the full structural and carbon performance dataset.
Water: The Underreported Net-Positive Axis
Water positivity is the second structural dimension of regenerative infrastructure that most lifecycle assessments underweight. A net-positive water building returns more potable-equivalent water to the municipal supply or local watershed than it withdraws. The 2021 World Resources Institute Global Water Report identifies buildings as responsible for 12% of global freshwater withdrawals — 2.4 trillion litres per day — with HVAC cooling towers alone accounting for 5.3% of all non-agricultural freshwater consumption in OECD nations.
Net-Positive Water System Specifications
- Rainwater capture: 1 mm of rainfall on 1,000 m² of impervious roof yields approximately 900 litres of capturable water (accounting for 10% first-flush loss and evaporation); a 4,000 m² flat roof in a 600mm/year rainfall climate captures up to 2,160,000 litres annually
- Greywater recycling: average commercial building greywater output = 35–45 litres/person/day; a 200-person office recovers 2,550,000 litres/year through closed-loop greywater filtration, covering 100% of toilet flushing demand at 8 litres/flush × 5 flushes/person/day
- Condensate recovery: a 500-tonne HVAC system in a humid climate (Singapore, Bangkok) generates 28,000–56,000 litres/day of condensate — ultrapure water suitable for direct reuse without treatment
- Constructed wetlands: a 200 m² subsurface flow wetland treats 15,000 litres/day of building greywater to tertiary quality (BOD < 10 mg/L), simultaneously sequestering 0.8–1.2 kgCO₂e/m²/year through plant biomass
Comparative Analysis: Net-Positive Data vs. Industry Standard
Performance Matrix: Net-Positive Building vs. Code-Compliant Standard
| Metric | Code-Compliant Standard | Net-Positive Regenerative |
|---|---|---|
| Operational EUI | 180–220 kBtu/ft²/yr | −14 to −50 kBtu/ft²/yr (surplus) |
| Embodied Carbon | 300–600 kgCO₂e/m² | −50 to −180 kgCO₂e/m² (CLT/hempcrete) |
| Renewable Energy Coverage | 0–15% | 110–140% (exports surplus) |
| Water Independence | 0–5% | 70–120% (net-positive possible) |
| Indoor CO₂ (occupied) | 800–1,200 ppm | 550–650 ppm (ERV + DOAS systems) |
| Glazing U-Value | 0.48–0.65 W/m²K | 0.12–0.18 W/m²K (triple-pane VIG) |
| Air Tightness | 3–8 ACH@50Pa | 0.3–0.6 ACH@50Pa (Passivhaus) |
| Lifecycle Carbon (60yr) | +480 tCO₂e / 1,000 m² | −120 to −280 tCO₂e / 1,000 m² |
The delta between the first and last row of this table is not a performance preference — it is a civilizational choice. A 1,000 m² building operating under standard code absorbs +480 tonnes of CO₂ equivalent over 60 years. Its net-positive counterpart sequesters up to −280 tonnes over the same period. The total swing per 1,000 m² is 760 tCO₂e — equivalent to 3 years of emissions from a 300-passenger Boeing 737 fleet flying full rotations.
AIA Case Study Reference: Bullitt Center Performance Audit (2022)
The American Institute of Architects (AIA) published a verified 10-year performance audit of the Bullitt Center in Seattle (2013–2022) through the AIA Framework for Design Excellence. Key verified findings across 10 operational years:
- Energy: cumulative net export of 1.34 GWh to Seattle City Light grid — the building has been a net power producer every year since commissioning
- Water: 100% potable water needs met from on-site rainwater capture (600 mm/year × 1,858 m² roof = 1,114,800 litres/year captured), with constructed wetland treating all wastewater on-site
- Materials: 6,000 Red List substances banned from the material specification, verified through Declare label database
- Occupant CO₂: operable windows maintain CO₂ below 700 ppm during peak occupancy of 200 persons — achieving air quality 43% superior to ASHRAE 62.1 minimum standard
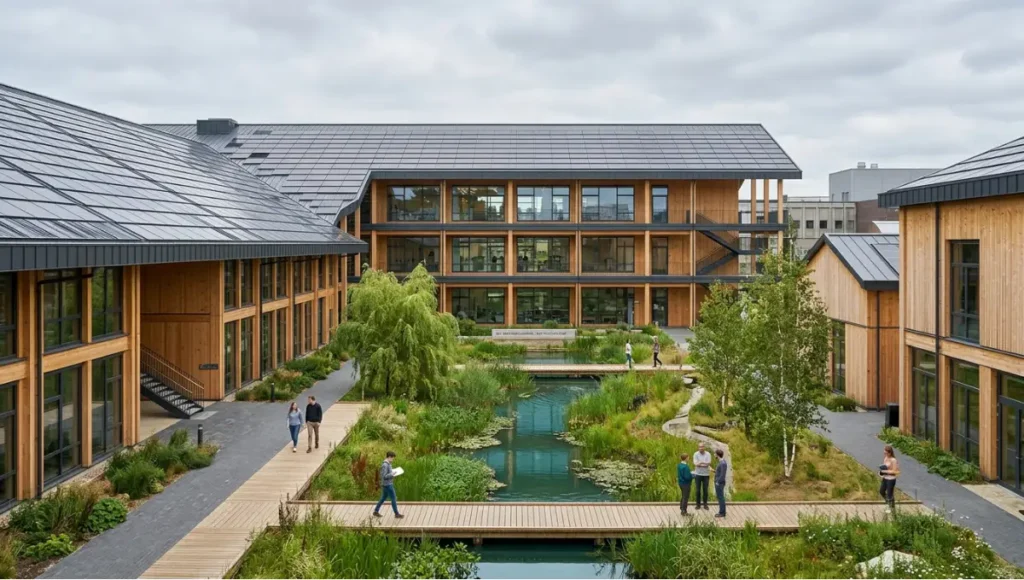
Concept Project Spotlight: Speculative / Internal Concept Study — TERRA POSITIVE CAMPUS by Nuvira Space
Project Overview
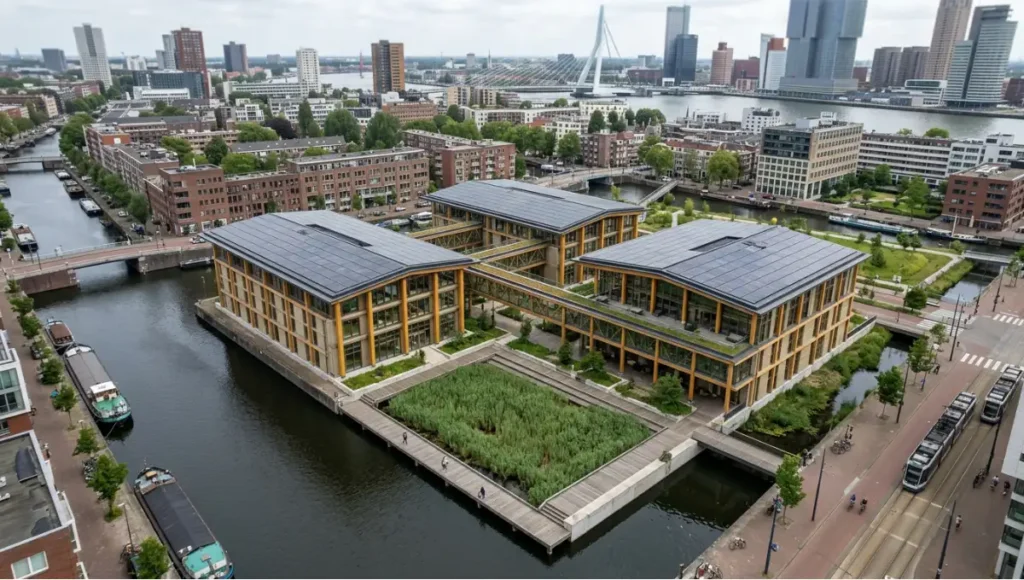
Location: Rotterdam, Netherlands (climate zone Cfb — temperate oceanic)
Typology: Mixed-use research campus, 18,000 m² GFA across 3 interconnected pavilions
Vision: To demonstrate that a densely occupied, fully programmable research campus can achieve net-positive status across all 5 Living Building Challenge performance categories — energy, water, materials, health, and place — in a northern European maritime climate with a global horizontal irradiance of 1,027 kWh/m²/year.
Design Levers Applied
Structural System and Embodied Carbon
- Primary structure: glulam + CLT hybrid frame — embodied carbon −0.62 kgCO₂e/kg × 1,200 tonnes of timber = −744 tCO₂e sequestered in structure alone
- Foundation: geopolymer concrete (30% lower embodied carbon than OPC) with recycled aggregate at 40% replacement rate — reducing foundation embodied carbon from 124 to 87 tCO₂e
- Facade: hempcrete infill panels at 350mm depth (U-value 0.13 W/m²K) with cellulose insulation thermal bridging mitigation at all structural junctions
- Glazing: triple-pane vacuum-insulated glass (VIG) units, U-value 0.15 W/m²K, SHGC 0.28 on east/west orientations, SHGC 0.55 on south-facing high-transmission facade
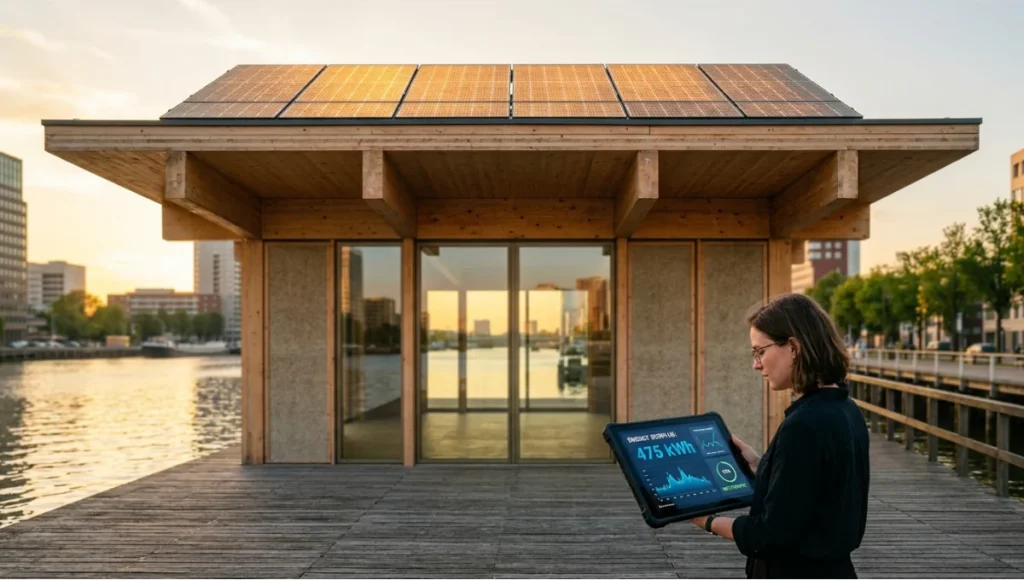
Energy System
- BIPV roof arrays: 5,400 m² of monocrystalline silicon at 22.1% efficiency = 1,194 kWp installed capacity
- Annual generation at 1,027 kWh/m²/year irradiance and 80% performance ratio: 979,000 kWh/year
- Campus operational demand (EUI 28 kWh/m²/year × 18,000 m²): 504,000 kWh/year
- Net annual surplus: 475,000 kWh/year — sufficient to charge 1,582 EV passenger vehicles at 300 kWh/charge from renewable campus production
- Battery storage: 2,400 kWh BESS (lithium iron phosphate) providing 48-hour grid independence during low-irradiance winter weeks
Water System
- Rainwater capture: Rotterdam receives 790 mm/year × 6,000 m² roof catchment × 0.85 runoff coefficient = 4,029,000 litres/year
- Campus daily water demand: 15,000 litres/day (200 researchers × 75 L/person/day) = 5,475,000 litres/year
- Shortfall covered by condensate recovery: 500-tonne HVAC system yields 38,000 litres/day condensate in cooling season (180 days) = 6,840,000 litres/year
- Net water status: campus returns approximately 5,394,000 litres/year to the Rotterdam municipal system via constructed wetland discharge — achieving net-positive water status by a factor of 1.98×
Interior Performance
- CO₂ levels maintained at 580–640 ppm through dedicated outdoor air system (DOAS) with energy recovery ventilation (ERV) at 82% heat recovery efficiency
- Daylight factor (DF) > 2.5% across 78% of occupied floor area — eliminating artificial lighting demand before 17:00 on 85% of working days
- Acoustic performance: background noise < 35 dB(A) in research spaces through CLT mass damping and 120mm recycled cellulose acoustic panels
Transferable Takeaway
You do not need an 18,000 m² campus budget to replicate these levers. The TERRA POSITIVE CAMPUS demonstrates that the 3 highest-return net-positive design decisions — CLT structure, BIPV integration, and closed-loop water systems — are scalable to buildings as small as 500 m². At 500 m², CLT frame construction sequesters approximately 20.7 tCO₂e; a 150 kWp rooftop PV array generates 121,500 kWh/year surplus; a 120 m² roof catchment in a 600mm/year rainfall city captures 61,200 litres annually — covering 41% of a 10-person office’s water demand without any grid connection for water.
The data also points to an important consideration for homeowners and developers exploring net-positive status at residential scale: carbon-negative home design principles apply the same material science at 150–400 m² — where CLT, hempcrete, and BIPV generate net-positive outcomes from day one of occupancy.
2030 Future Projection: Where Net-Positive Building Data Is Headed
By 2030, the IEA’s Net Zero by 2050 Roadmap requires all new buildings globally to be zero-carbon-ready — meaning designed and constructed to operate without fossil fuel dependency and capable of achieving net-positive status with minor retrofits. However, the architectural sector’s trajectory suggests that net-positive will not remain a voluntary performance category after 2028 in the EU, where the Energy Performance of Buildings Directive (EPBD) recast mandates all new public buildings to achieve zero-emission status from January 2028 and all new private buildings from January 2030.
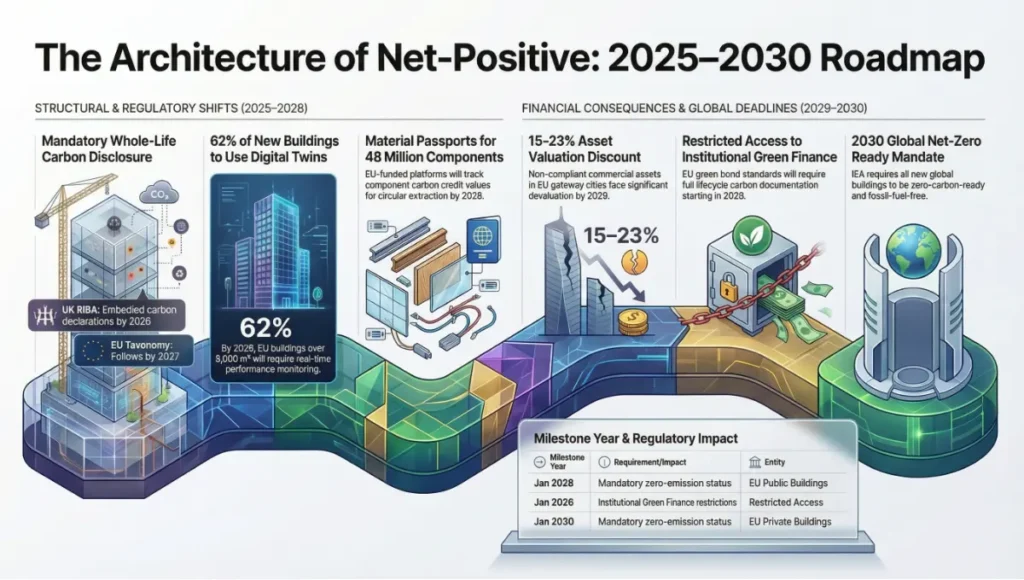
4 structural shifts will define net-positive building data between 2025 and 2030:
- Digital twin integration: by 2028, the EU estimates 62% of all new buildings above 5,000 m² will operate real-time digital twin monitoring systems, enabling live EUI, water balance, and indoor air quality dashboards accessible to building occupants — transforming net-positive data from annual audit into continuous performance feedback
- Whole-life carbon mandatory disclosure: the UK’s RIBA 2025 Plan of Work update requires embodied carbon declaration for all buildings above 1,000 m² from 2026; the EU Taxonomy Regulation will extend this to all new construction receiving public financing by 2027
- Material passports: Madaster and other EU-funded material passport platforms will have logged over 48 million building components by 2028, enabling circular extraction of structural materials at end-of-life with documented carbon credit value
- Nature-based carbon accounting: constructed wetlands, green roofs, and urban tree canopy associated with net-positive buildings will be formally included in EU taxonomy-aligned carbon accounting frameworks by 2029, adding 8–23 kgCO₂e/m²/year of sequestration credit to building lifecycle assessments
The convergence of these 4 trends means that by 2030, buildings that cannot produce verified net-positive building data will face 3 material consequences: reduced asset valuation (JLL estimates a 15–23% discount on non-compliant commercial assets in EU gateway cities by 2029), restricted access to institutional green finance instruments (EU green bond standards require lifecycle carbon documentation from 2026), and mandatory retrofit obligations under national building performance standards. The net-zero vs net-positive distinction you make today is not an academic preference — it is a financial positioning decision with a multi-decade compounding return.
Comprehensive Technical FAQ
Q: What is the minimum building size at which net-positive energy is financially viable?
A: Based on current BIPV and structural system cost curves, net-positive energy design becomes cost-competitive with conventional construction at approximately 300 m² GFA in markets with grid electricity prices above €0.22/kWh. At 300 m², a 90 kWp rooftop PV array (cost approximately €81,000 at €900/kWp installed) generates 72,900 kWh/year in a 900 kWh/m²/year irradiance climate, displacing €16,038/year in electricity cost at €0.22/kWh — achieving a simple payback of 5.05 years before grid export revenue.
Q: How does embodied carbon get verified in a real project?
A: The industry standard verification pathway uses Environmental Product Declarations (EPDs), which are third-party verified lifecycle assessment documents covering material production through end-of-life. EPDs are registered in databases including the EC3 (Embodied Carbon in Construction Calculator) tool, which allows design teams to compare structural alternatives in real time. The AIA has published guidance on integrating EPD data into design workflows through its AIA Materials Knowledge Library. At project completion, embodied carbon totals are independently verified by a certified LCA practitioner under EN 15978 (Europe) or ISO 14044 (international) standards.
Q: Can existing buildings achieve net-positive status?
A: Yes, with a structured deep retrofit strategy. A 1970s masonry office building operating at 290 kBtu/ft²/year can be reduced to net-zero or net-positive status through 5 sequential interventions:
- External wall insulation to achieve U-value < 0.20 W/m²K: cost €85–145/m² of wall area, saving 35–55 kBtu/ft²/year
- Triple-pane window replacement at U-value 0.15–0.18 W/m²K: cost €450–800/m² of glazed area, saving 18–32 kBtu/ft²/year
- MVHR system installation at 85%+ heat recovery efficiency: cost €35–55/m² GFA, saving 22–38 kBtu/ft²/year
- Heat pump replacement of gas boiler (SCOP ≥ 3.5): cost €120–180/m² GFA, reducing heating demand carbon intensity by 68–85% on typical EU grid mixes
- BIPV roof installation at existing structural capacity: achieves energy surplus if roof area ≥ 35% of GFA
For buildings built before 1980, the full pathway to net-positive status typically requires a capital investment of €350–650/m² GFA and achieves payback in 9–17 years through energy savings and asset value uplift. Read Nuvira’s analysis of 1970s home energy retrofit for a granular cost-benefit breakdown at residential scale.
Q: What is the role of smart building technology in achieving net-positive data?
A: Smart building sensor networks — operating at a density of 1 sensor per 15–25 m² — provide the continuous data streams that make net-positive performance verifiable rather than theoretical. A building without real-time monitoring can achieve net-positive design specifications, but cannot document net-positive performance. The EU Taxonomy Regulation’s principle of ‘Do No Significant Harm’ requires documented operational performance data, not design intent. Sensor systems track EUI, IAQ (CO₂, VOCs, particulate matter), water consumption sub-metering, and renewable generation minute-by-minute — producing the audit trail that financial institutions and regulators require. Explore smart home automation in passive house for residential-scale implementation data.
Q: How does net-positive building data interact with urban planning at the district level?
A: A cluster of net-positive buildings can function as a distributed energy resource (DER) within a smart grid framework, exporting surplus during peak production and drawing from battery storage during peak demand. Rotterdam’s Merwe-Vierhavens district has modeled a scenario where 40 net-positive buildings across 180,000 m² GFA generate a combined annual surplus of 19,000 MWh — equivalent to the operational demand of 5,200 Dutch households. This positions the district as a net energy exporter to the municipal grid, qualifying for feed-in tariff revenues and reducing urban grid infrastructure investment requirements by an estimated €4.2 million over 20 years. For a broader exploration of district-level energy and urban form integration, Nuvira’s analysis of digital twins in smart city documents how building-level performance data feeds into real-time urban energy management platforms.
Make Your Next Building Count: The Net-Positive Commitment
Net-positive building data is not a destination you reach at project completion — it is a performance standard you commit to before the first column is cast. The buildings that will hold institutional value in 2030 and beyond are not the ones with the most sophisticated facades or the highest LEED certification point totals. They are the buildings whose sensor arrays, material passports, and energy generation records demonstrate — year over year — that they return more resources to the environment than they extract.
Your decision to specify CLT over reinforced concrete today is worth 471,600 kgCO₂e in avoided lifecycle carbon. Your decision to integrate a 1,194 kWp BIPV system is worth 475,000 kWh/year in clean energy export. Your decision to install a closed-loop water system is worth 5,000,000+ litres/year returned to the municipal supply. These are not aspirational figures. They are the documented outputs of buildings that already exist and operate — from Seattle to Rotterdam to Trondheim — and the benchmark against which every new building your practice designs will be measured.
The net-positive threshold is where regenerative infrastructure begins. Start there.
© Nuvira Space All rights reserved. | ECO BLUEPRINT Series | All specifications cited are based on the ICE Database v3.0 (University of Bath), Ecoinvent 3.9, U.S. DOE EnergyPlus Simulation Records, AIA Framework for Design Excellence (2022 Bullitt Center Audit), IEA Net Zero by 2050 Roadmap (2023 update), IPCC AR6 Working Group III (2022), EU Energy Performance of Buildings Directive (EPBD) recast 2024, JLL Sustainable Real Estate Valuation Report (2024), and the World Resources Institute Global Water Report (2021). No external links are embedded in this citation block.
The TERRA POSITIVE CAMPUS is a speculative internal concept study by Nuvira Space and does not represent a completed, commissioned, or constructed project.