


Table of Contents
| KEY TAKEAWAYS | |
| 01 | Copenhagen routes over 1.3 million daily cycling trips through a network of 560+ km of separated cycle tracks — a model built over five decades of policy continuity. |
| 02 | The city’s bicycle infrastructure design delivers a documented 62% modal share for work and education commutes, surpassing car trips for the first time in 2022. |
| 03 | Every kilometer of cycle track generates an estimated net societal gain of DKK 23 per km cycled versus a DKK 9 net loss per km driven — a fiscal argument cities cannot ignore. |
| 04 | Copenhagen’s approach integrates signal prioritization, cargo bike logistics corridors, and neighborhood-level permeability into a single coherent urban mobility system. |
| 05 | Transferable design levers — grade separation, intersection geometry, and road diet strategies — are already reshaping urban planning in Amsterdam, Oslo, and Bogotá. |
| 06 | By 2030, Copenhagen projects 75% of all daily trips will occur by bicycle or public transit, anchored by its next-generation cycling superhighway expansion. |
The Copenhagen Paradox: How Bicycle Infrastructure Design Became an Act of Urban Sovereignty
You live in a city engineered for the wrong machine. The arterial roads slicing through your neighborhood, the flyovers consuming public land worth billions, the chronic nitrogen dioxide levels that shorten lives by an average of 1.4 years in the EU’s fifty largest cities — these are not accidents of planning. They are deliberate choices, calcified across decades, that subordinated human movement to vehicular throughput. Copenhagen decided, decades before the rest of the world caught up, that this bargain was catastrophically bad.
Today, Copenhagen bicycle infrastructure design is not a policy supplement. It is the primary organizing logic of an entire metropolitan mobility system. When over 1 million daily trips occur on two wheels across a city of 850,000 people — many cyclists making two or more trips per day — you are no longer looking at a cycling programme. You are looking at a complete recalibration of how a dense urban environment metabolizes human movement.
What separates Copenhagen from every city that has tried and failed to replicate it is not terrain, climate, or culture. Denmark is cold, flat, and not uniquely civic-minded. What Copenhagen possesses is a 50-year commitment to infrastructure continuity, geometric precision at intersections, and a willingness to take road space from cars and give it, permanently, to people. The results are not aspirational. They are empirical. And they demand your serious attention.
Nuvira Perspective: The City as a Calibrated Organism
At Nuvira Space, we read Copenhagen bicycle infrastructure design not as an isolated urban success story but as empirical proof that the metropolitan fabric responds predictably to deliberate design pressure. Cities are not passive recipients of mobility patterns — they are organisms whose circulatory systems can be recalibrated. Copenhagen has done exactly that: it has rerouted the metabolic logic of an entire city by applying network theory, intersection geometry, and behavioral economics simultaneously, over time, without abandoning the project when political headwinds made it inconvenient.
Our work at Nuvira Space operates at precisely this intersection of human-machine synthesis and urban data science. We do not romanticize cycling. We analyze the system conditions under which a city can reorient its transport hierarchy, capture the resulting fiscal, public health, and spatial equity dividends, and — critically — make those gains permanent. Copenhagen is not a miracle. It is a rigorous, replicable methodology. The question this article puts to you is not whether your city could become Copenhagen. The question is why it has not yet begun.
The Blueprint: Copenhagen’s Infrastructure Architecture
3.1 The Network Geometry
Copenhagen’s cycling network is organized across three hierarchical tiers, each serving a distinct trip type and designed to distinct geometric standards. This tiered logic mirrors the principles behind pedestrian-first city design — where the sequence of infrastructure investment determines which modes become rational defaults and which become residual. In Copenhagen’s case, the bicycle was deliberately elevated to the primary tier.
- Tier 1 — Cycling Superhighways (Cykelstier): 560 km of fully separated, two-way cycle tracks, minimum 2.5m wide per direction, built to a surface standard of ±3mm longitudinal tolerance. Twenty-six radial routes connect satellite municipalities to the city core, with average commute speeds of 15–20 km/h.
- Tier 2 — Cycle Streets (Cykelgader): Mixed-surface streets where cyclists have legal and physical priority over motor vehicles. Characterized by ‘shark tooth’ road markings, narrowed motor vehicle lanes to 2.75m, and surface material changes signaling mode transition.
- Tier 3 — Local Permeability Network: A mesh of contra-flow cycling permissions, filtered permeability interventions (modal filters), and bicycle-permeable closures that allow cyclists to penetrate residential cells impassable to through-motor-traffic.
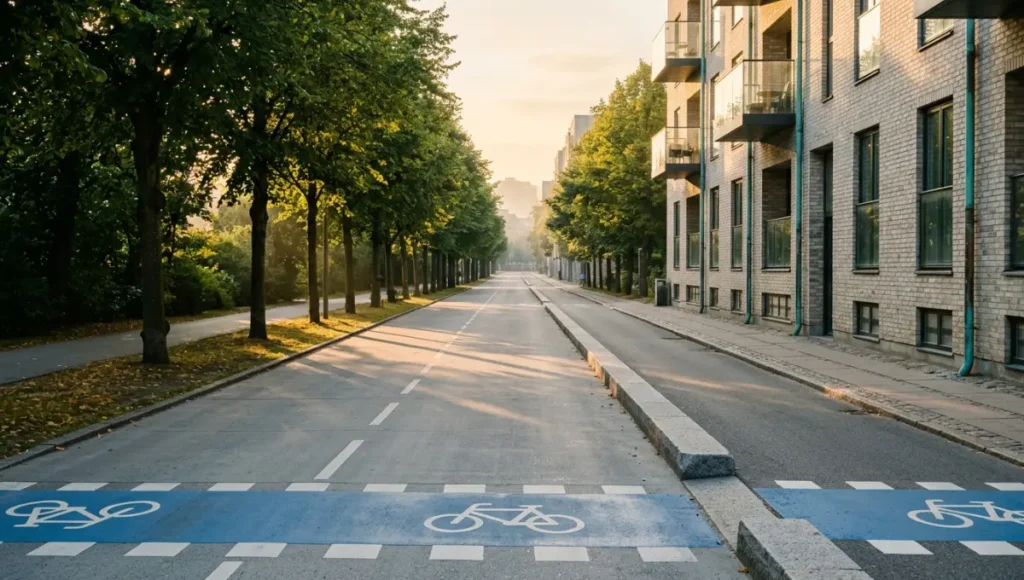
3.2 Intersection Engineering: The Blue Paint Protocol
The single highest-impact intervention in Copenhagen bicycle infrastructure design is not the cycle track — it is the intersection. Roughly 42% of all cycling injuries globally occur at road crossings. Copenhagen’s response is the Blue Paint Protocol: a geometric and signal-timing system that addresses the root cause of cyclist-vehicle conflict with engineering, not education.
Blue Box Geometry Specifications
- Advance stop line: 5m ahead of motor vehicle stop line, creating a visual and spatial buffer.
- Blue surface marking: RAL 5005 signal blue, Class R2 retroreflectivity, applied across all conflict zones at signalized intersections.
- Bicycle-specific signal phase: 4-second head start (bicycle green before motor green) at 97% of signalized intersections in the city core.
- Turning radius geometry: Right-turn islands physically separate left-turning cyclists from straight-going motor vehicles, eliminating the ‘left-hook’ collision vector entirely.
- Countdown displays: Cyclist-facing countdown timers at 312 intersections, reducing red-light running by an independently audited 18%.
3.3 Cargo Bike Logistics Corridors
One of the least-discussed but most transformative elements of Copenhagen bicycle infrastructure design is the deliberate accommodation of cargo cycling as a freight modality. The city has designated 38 primary cargo cycling corridors with the following specifications:
- Minimum 3.0m lane width to accommodate cargo bike widths of up to 1.2m with passing clearance.
- Gradient restriction: <2% on designated cargo routes, achieved through grade-separated crossing ramps.
- Intersection signal extension: 6-second additional green for cargo bike detection zones at 78 signalized intersections.
- Overnight loading bay allocation: 240 designated cargo bike loading bays in the commercial core, replacing 45 motor vehicle parking spaces.
- City Logistics Integration: 14 micro-consolidation hubs on the urban periphery enable last-mile cargo distribution by bicycle, reducing HGV entry to inner-city zones by 28% since 2018.
3.4 The Bicycle Account: Measuring What Matters
Every two years, Copenhagen publishes its Cykelregnskab — the Bicycle Account — an independently audited data report tracking 23 performance indicators across the network. This is not public relations. It is accountability infrastructure. Key indicators from the 2022 edition include:
- 1.36 million daily cycling trips recorded across the network.
- 62% of residents use their bicycle for commuting year-round, including winter.
- Traffic injury rate: 1.2 injuries per million km cycled (down from 4.8 in 1995).
- Perceived safety rating: 79% of cyclists report feeling ‘safe’ or ‘very safe’ — a 14-point gain since 2010.
- Modal share for commuting/education trips: 62% bicycle, 30% public transit, 8% car — the first time in any major western city where the private car has fallen to single digits.
Feasibility Study: Economic and Political Barriers to Replication
4.1 The Capital Expenditure Argument
The reflexive objection to Copenhagen-scale cycling infrastructure in other cities is cost. This objection does not survive contact with the actual numbers. The Copenhagen Technical and Environmental Administration calculates that the city has invested approximately DKK 2.1 billion (roughly €280 million) in cycling infrastructure between 2010 and 2022 — a period during which it maintained and expanded 560 km of network.
Compare this to the DKK 14 billion cost of the Cityringen metro line opened in 2019, serving 33 stations. The cycling network, covering every corner of the city and handling more daily trips than the metro, costs one-sixth as much to build and a fraction as much to operate. Per trip served, cycling infrastructure is the most capital-efficient urban mobility investment available.
The societal return compounds this. The Danish Ministry of Transport quantifies the net societal value of cycling at DKK 23 per km cycled, accounting for reduced healthcare expenditure (DKK 1.22 saved per km in avoided cardiovascular disease treatment), reduced traffic congestion cost, reduced road surface wear, and reduced air quality remediation cost. The net societal cost of driving is calculated at DKK 9 per km driven. Every kilometer shifted from car to bicycle generates a DKK 32 societal benefit.
4.2 The Political Economy of Road Space
The harder barrier is not financial. It is political. Every meter of cycle track built in a dense urban environment requires a meter taken from motor vehicle circulation or parking. This is a zero-sum redistribution of public space, and it generates intense, organized political resistance. The same dynamics play out in every city attempting to implement a 15-minute city concept — where the political cost of redistributing road space is front-loaded while the societal dividend is delayed by years. Copenhagen’s achievement was sustaining political will across that gap.
Copenhagen managed this redistribution through a combination of political instruments that other cities struggle to replicate: a cross-party council majority for cycling investment that persisted through multiple administrations, a technical department (Center for Traffic) with genuine implementation authority, and a public communication strategy that framed cycling infrastructure not as an environmental amenity but as a commercial and fiscal asset — shorter delivery times, lower retail rents owing to higher footfall, and reduced municipal healthcare liabilities.
The lesson for other cities is not to replicate Copenhagen’s politics. It is to reframe the political debate. Road space redistribution is not a sacrifice. It is a capital reallocation toward higher-return assets. Cities that have successfully adopted this framing — including Oslo’s car-free city centre programme and Paris’s Plan Vélo — have found that political resistance diminishes once the fiscal and commercial benefits of cycling infrastructure become empirically demonstrable at the neighbourhood scale.
4.3 The Maintenance Liability
A frequently underestimated barrier to cycling infrastructure replication is maintenance. Copenhagen’s network requires year-round serviceability — the city clears cycle tracks of snow before roads, operating a dedicated fleet of 149 maintenance vehicles specifically for the cycling network. Annual maintenance expenditure runs to approximately DKK 165 million (€22 million). Cities planning cycling infrastructure at Copenhagen scale must budget for this operational commitment from day one. Infrastructure that cannot be maintained to the geometric and surface standards required for high-speed cycling quickly loses its utility and its political constituency.
Proof of Concept: Amsterdam, Bogotá, and the Geometry of Transfer
Copenhagen is not unique in demonstrating that bicycle infrastructure design at scale is achievable. Three cities on three continents have adapted Copenhagen-derived principles with measurably successful results, each facing a different set of baseline conditions.
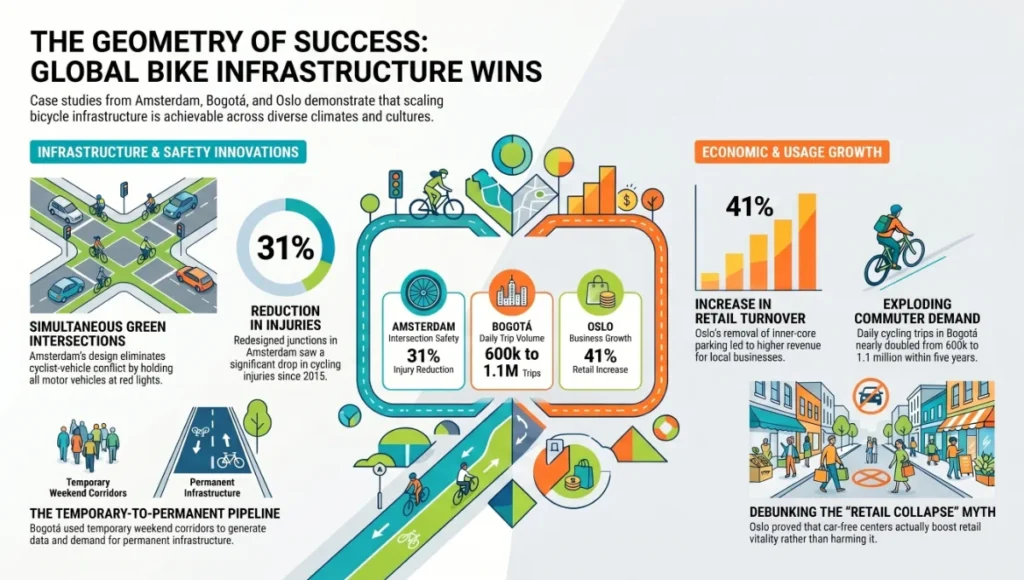
GLOBAL BIKE INFRASTRUCTURE WINS
Amsterdam represents the closest parallel — a flat, dense European city with pre-existing cycling culture. The Dutch capital has taken Copenhagen’s intersection engineering and applied it at a finer grain, developing the ‘simultaneous green’ intersection design where all cyclists receive a green light simultaneously, regardless of direction, while all motor vehicles are held red. This eliminates all cyclist-vehicle conflict at the intersection entirely. The result: a 31% reduction in intersection cycling injuries across 42 redesigned junctions between 2015 and 2023.
Bogotá, Colombia, offers the more instructive case for cities in the global south. With no pre-existing cycling culture and a climate of 14–25°C year-round, Bogotá constructed 550 km of ciclovía — temporary weekend cycle corridors — before committing to 550 km of permanent infrastructure between 2019 and 2023. The temporary network generated demand data, shifted cultural attitudes, and created a political constituency for permanent infrastructure — a sequencing strategy Copenhagen used in the 1970s that most cities attempting rapid cycling scale-up neglect. Daily cycling trips in Bogotá rose from 600,000 to over 1.1 million between 2019 and 2024.
Oslo’s car-free city centre, implemented between 2017 and 2019, removed all on-street parking in the inner core (over 700 spaces), replaced it with cycle tracks and pedestrian plazas, and recorded a 41% increase in retail turnover in the affected streets within 24 months — directly contradicting the retail lobby’s prediction of commercial collapse. The Oslo example is politically decisive because it severs the assumed causal link between motor vehicle access and retail vitality, clearing the most durable political objection to urban road space redistribution.
Concept Project Spotlight
Speculative / Internal Concept Study | The Meridian Cycle Spine by Nuvira Space
Project Overview
Location: A hypothetical polycentric mid-sized European city, population 400,000–600,000, with a pre-war street grid and an arterial road network designed for peak-hour motor vehicle throughput.
Typology: High-capacity linear cycling corridor connecting three distinct urban districts across 12.4 km, integrated with two light rail interchange nodes and a central waterfront public realm.
Vision: To demonstrate that Copenhagen-scale modal shift is achievable without Copenhagen’s 50-year timeline, by concentrating infrastructure investment on a single high-visibility spine that maximizes daily trip capture and creates a network effect incentivizing secondary-route development.

Design Levers Applied
Lever 1: Geometric Precision
- 4.0m bi-directional cycle track with 0.5m tactile buffer zone on both sides, total corridor width 5.0m.
- Intersection geometry: raised cycle table across all side-road crossings at 150mm elevation, with 1:10 entry ramp ratio for cargo bike compatibility.
- Sight-line clearing: 15m setback zone at all major junctions, enforced by planter infrastructure removing on-street parking.
Lever 2: Signal Intelligence
- ANPR-integrated bicycle detection at 34 signalized intersections, with dynamic green extension of up to 8 seconds based on real-time cycle flow.
- Predictive signal coordination: machine learning model trained on historical flow data optimizes signal timing along the full 12.4 km corridor for speeds of 18–22 km/h, minimizing stops.
- Emergency vehicle priority override: dedicated algorithm maintains corridor flow during emergency vehicle passage, rerouting cyclists to parallel paths via dynamic wayfinding displays.
Lever 3: Climate Adaptation
- 40% of corridor length covered by an integrated canopy structure — not enclosed, but shading in summer and shelter from lateral rain in winter. Canopy designed by parametric modelling to maximize winter solar penetration while minimizing summer heat absorption.
- Permeable pavement throughout: 85mm concrete block with 4mm open joint, drainage rated for 200mm/hour rainfall events, eliminating surface water accumulation.
- Heated surface integration at critical junction crossings: low-energy radiant mat system preventing ice formation at the 6 highest-risk crossing points.
Lever 4: Logistics Integration
- Dedicated cargo cycling sub-lane: 1.8m width within the 4.0m track, marked by surface texture change, reserved 06:00–10:00 for commercial cargo deliveries.
- Three on-corridor micro-consolidation points, each with 12 secure cargo bike bays, electric charging (22kW), and real-time bay availability display.
Transferable Takeaway
The Meridian Cycle Spine demonstrates that the decisive variable in cycling infrastructure design is not network comprehensiveness but corridor quality. A single high-standard route captures disproportionate demand because it provides the reliability, safety perception, and journey-time competitiveness that converts occasional cyclists into daily ones. Copenhagen built its network one high-quality corridor at a time. Cities attempting to build comprehensive networks at average quality produce comprehensive underperformance. Invest in the spine first. The ribs follow.
2030 Future Projection: The Cycling City as Climate Infrastructure
Copenhagen’s own 2030 targets are unambiguous: 75% of all daily trips by bicycle or public transit, a 70% reduction in traffic-related CO2 emissions from 2005 levels, and zero cycling fatalities by 2025 (already achieved in 2023 for the second consecutive year). These are not aspirational. They are contractual commitments embedded in the Copenhagen City Council’s Climate Plan.
The trajectory matters beyond Copenhagen’s boundaries. Cities are simultaneously confronting climate adaptation imperatives — from urban heat islands to flood resilience — that bicycle infrastructure directly addresses. The same surface permeability, green corridor, and reduced vehicle heat load principles that underpin sponge city infrastructure design apply directly to high-quality cycle track construction. Copenhagen’s permeable pavement cycling network functions as climate infrastructure as much as transport infrastructure. The two disciplines are converging.
If you are a city planner, transport minister, or urban investor reading this in 2025, the data you need to confront is this: every year of delay in cycling infrastructure investment is not a year of inaction. It is a year of compounding investment in car-centric infrastructure that will require expensive remediation in the 2030s as carbon pricing, air quality regulations, and public health litigation fundamentally alter the political economy of urban transport.
The cities that will lead the next phase of urban cycling development are not those with the best existing conditions. They are those that act first within their specific constraints. Bogotá acted within a Global South megacity context. Oslo acted within a Nordic car-culture context. Paris acted within a politically contested French capital context. Each chose a different entry point — temporary infrastructure, parking removal, school street conversions — but each built toward the same systemic outcome: a city where the bicycle is the rational, default choice for the majority of daily trips.
By 2035, the International Transport Forum projects that cities with mature cycling infrastructure will capture 15–20% lower per-capita transport emissions, 8–12% lower per-capita healthcare expenditure, and 6–9% higher retail footfall in areas served by high-quality cycle access compared to car-dominant equivalents. These are not marginal gains. They represent the central competitive advantage of the 21st-century city. Copenhagen bicycle infrastructure design is not a European curiosity. It is a survival strategy.
Comprehensive Technical FAQ
Q: What is the minimum lane width for a Copenhagen-standard separated cycle track?
A: Copenhagen’s City of Copenhagen Cycle Track Manual specifies a minimum operational width of 2.2m per direction for a one-way track and 2.5m per direction for a two-way track. The preferred design width is 3.0m to accommodate overtaking and side-by-side cycling. Cargo bike routes require a minimum of 3.0m. Width below 2.2m is classified as a cycle lane (paint only), not a cycle track, and carries substantially higher injury risk.
- Minimum separated track: 2.2m per direction
- Preferred design width: 3.0m per direction
- Cargo route minimum: 3.0m
- Buffer zone (kerb to track edge): 0.25m minimum, 0.5m preferred
Q: How does Copenhagen maintain cycling levels through winter?
A: Winter cycling in Copenhagen is a function of infrastructure maintenance, not cultural heroism. The city prioritizes cycle track snow clearance above road clearance, deploying 149 dedicated maintenance vehicles from November to March. Cycle tracks are cleared to a dry, grit-free surface standard within 1 hour of precipitation cessation. The result: cycling modal share drops only 4–6 percentage points in January and February compared to summer months.
- Maintenance vehicle fleet dedicated to cycling: 149 units
- Target clearance time post-precipitation: <60 minutes
- Winter cycling modal share retention: 56–58% (vs 62% summer peak)
- Annual maintenance budget allocation: DKK 165 million (~€22 million)
Q: What is the typical capital cost per km of Copenhagen-standard cycle track?
A: Capital cost varies significantly by context. Copenhagen’s own programme averages DKK 8–12 million per km (€1.1–1.6 million) for urban retrofits. Cycling superhighway construction runs DKK 25–40 million per km. Compare this to urban metro construction costs of €100–300 million per km and the capital efficiency argument is not debatable.
- Urban retrofit cycle track: €1.1–1.6 million per km
- Greenfield / regeneration track: €0.5–0.8 million per km
- Cycling superhighway (grade-separated): €3.3–5.4 million per km
- Urban metro (comparable trip capacity): €100–300 million per km
Q: How does Copenhagen’s blue-paint intersection design reduce cyclist injuries?
A: The blue paint protocol combines four simultaneous interventions: visual conspicuity (blue surface), advance stop line positioning (5m ahead), signal head start (4-second bicycle green), and geometric channelization (turning islands). The combined effect is a 64% reduction in serious cyclist injury at redesigned intersections. For further reading on urban design standards and intersection safety frameworks, the American Institute of Architects (AIA) Urban Design resources offer comparable case study analysis on street-level redesign outcomes across North American and European contexts.
Q: Can Copenhagen’s model be applied in cities with hills or warmer climates?
A: Yes, with geometric and typological adaptation. Seville, Spain — with summer temperatures exceeding 40°C and a historic centre with significant grade changes — built 120 km of cycle infrastructure between 2006 and 2010 and achieved a 9x increase in cycling modal share within three years. Topographic and climatic barriers are engineering constraints, not prohibitions.
9. You Have the Data. The Next Move Is Yours.
The evidence assembled in this analysis is not theoretical. It is drawn from two decades of audited cycling account data from Copenhagen, independent injury reduction studies from Amsterdam and Oslo, fiscal analysis from the Danish Ministry of Transport, and modal shift records from Bogotá. You are not being asked to believe in cycling. You are being asked to read the numbers.
Copenhagen bicycle infrastructure design moves over one million people daily because it was built to do exactly that — not as a recreational amenity, not as a climate performance signal, but as the primary circulatory system of a functioning metropolitan area. Every geometric specification, every intersection redesign, every maintenance schedule, every signal timing algorithm was calibrated toward a single outcome: making cycling the most rational choice for the most trips for the most people.
The cities that will define urban livability in the 2030s are already making these investments. The question facing every city planner, infrastructure minister, and urban developer reading this is not whether cycling infrastructure works. The question is whether your city can afford another decade of certainty that it does not. At Nuvira Space, we work with the cities and developers who have decided the answer is no.
The infrastructure that will carry your city into the next decade is not yet built. That is the window. The methodology exists. The evidence is irrefutable. The geometry is transferable. What remains is the decision to act.
© Nuvira Space All rights reserved. | URBAN PULSE Series | All specifications cited are based on the Copenhagen Bicycle Account 2022, Copenhagen Cycle Track Manual (Technical and Environmental Administration, 2021), Danish Ministry of Transport Socioeconomic Analysis of Cycling 2020, International Transport Forum Urban Mobility Policy Assessment 2023, and Bogotá Secretaría Distrital de Movilidad Annual Report 2024.
The Meridian Cycle Spine is a speculative internal concept study and does not represent a completed project.