

Table of Contents
Macro-Observation Hook. BIM Software Sustainable Home Guide
The residential construction sector accounts for 21% of total building-related CO₂ emissions globally — and the majority of that damage is locked in before a single wall is raised. Design decisions made in the first 3% of a project’s timeline determine up to 70% of its lifetime energy performance. Yet most homeowners and even many architects still greenlight sustainable home projects using disconnected spreadsheets, static CAD drawings, and post-design energy checks that arrive too late to matter. BIM software for sustainable home design does not merely digitize this process — it inverts it. And the 5 thermal metrics embedded inside a properly configured BIM workflow are the exact levers that separate a home that performs from one that only promises.
Nuvira Perspective
At Nuvira Space, we reject the idea that sustainable home design is a compliance exercise. It is a precision engineering problem — and precision requires data structures, not intentions.
The future of residential architecture is not defined by which materials you specify or which certification you chase. It is defined by how early in the design process your simulation environment speaks back to you. BIM software — specifically when configured around thermal performance modeling — creates a closed-loop feedback system between architectural intent and measurable built outcome.
This is the human-machine synthesis that drives everything we do: not automation for its own sake, but computational intelligence deployed at the exact decision point where it changes the outcome. When you run a solar radiation analysis at 7:42 AM on a schematic model and it forces you to rotate the structure 14° on its axis before you’ve touched a permit drawing, that is not convenience. That is a different category of architecture.
Technical Deep Dive: What BIM Software Actually Does Inside a Sustainable Home Workflow
The Information Model Is Not a 3D Drawing
The persistent misconception about BIM software is that it produces better drawings. It does not. It produces a parametric data environment in which geometry, material properties, energy behavior, structural loads, and lifecycle cost are co-dependent variables that update in real time. For sustainable home design, this means:
- Every wall assembly carries its U-value, thermal mass (kJ/m²K), and vapor diffusion resistance (μ-value)
- Window objects store their solar heat gain coefficient (SHGC), visible light transmittance (VT), and U-factor simultaneously
- The orientation of the building is not a design preference — it is a variable that cascades into daylighting lux values, HVAC sizing, and annual energy use intensity (EUI) expressed in kBtu/ft²/yr
When you change the wall thickness from 200 mm to 350 mm in a BIM model configured for sustainability, 14 downstream calculations update automatically. That is not a feature. That is a fundamentally different design methodology. The cost implications of this kind of parametric iteration are equally significant — as explored in Nuvira Space’s analysis of generative design cost savings — where early-stage algorithmic decision-making consistently outperforms late-stage value engineering.
The 5 Thermal Metrics That Define BIM-Driven Sustainable Home Performance
These are not aspirational targets. They are the 5 quantitative outputs that a properly configured BIM environment surfaces before design development concludes — and each one carries direct consequence for how the home performs and how the occupant lives inside it.
Thermal Metric 1: Annual Energy Use Intensity (EUI)
Unit: kBtu/ft²/yr (US) or kWh/m²/yr (metric)
EUI is the single most consequential number in residential energy performance. A code-minimum US home typically registers between 40–60 kBtu/ft²/yr. A Passive House-certified residence targets ≤ 4.75 kBtu/ft²/yr for heating demand. The gap between those figures is not incremental — it represents an entirely different thermal envelope design strategy.
BIM software calculates EUI through integrated energy analysis plugins:
- Autodesk Insight (Revit-native): Generates EUI benchmarks against ASHRAE 90.1 baselines with parametric sliders for WWR (window-to-wall ratio), orientation, insulation R-values, and HVAC efficiency ratings
- One Click LCA (plugin, multi-platform): Crosses operational EUI with embodied carbon to surface the full lifecycle energy picture
- IES VE (standalone + Revit link): Runs dynamic thermal simulations using actual meteorological year (AMY) weather files rather than typical meteorological year (TMY) data — critical for climate-resilient design post-2025
So what? A homeowner choosing between 2 window specifications that look identical visually may be choosing between an EUI of 38 and an EUI of 29 — a difference of $1,200–$1,800/year in energy cost over a 30-year mortgage horizon. BIM makes that number visible at the point of specification, not after construction.
Thermal Metric 2: Solar Heat Gain Coefficient (SHGC) at Facade Level
Unit: Dimensionless (0–1 scale), typically reported per elevation (N/S/E/W)
SHGC is the fraction of solar radiation admitted through a glazing assembly. A value of 0.25 means 25% of incident solar energy passes through the glass as heat. But the critical error most residential projects make is applying a single SHGC value across all 4 facade orientations — a decision that BIM workflow immediately exposes as thermally irrational.
In a south-facing passive solar home in Copenhagen (latitude 55.6°N), a high-SHGC south glazing (SHGC 0.55–0.60) combined with a properly calculated overhang depth (typically 450–600 mm for that latitude and floor-to-ceiling height) allows winter solar gain to displace 18–22% of annual heating load. The same high-SHGC specification on the west facade without external shading adds 15–20% summer cooling load — destroying the passive strategy entirely.
BIM workflow surfaces this through:
- Per-elevation radiation mapping — Revit + Insight generates solar radiation heat maps (kWh/m²) for each facade surface across the full annual cycle
- Overhang depth optimization — parametric modeling iterates overhang geometry in 25 mm increments against the 21 March/21 June/21 December sun angle for the building’s precise latitude
- Glazing schedule linked to SHGC database — window families in ArchiCAD and Revit carry manufacturer-specific SHGC values that flow directly into energy calculations, eliminating manual data transfer errors
Thermal Metric 3: Thermal Bridging Factor (Ψ-value / Psi-value)
Unit: W/(m·K)
This is the metric that most residential architects cannot name — and the one most responsible for the gap between a home’s modeled and actual performance. Thermal bridging occurs wherever a thermally conductive material penetrates the insulation layer: structural steel columns, balcony slab extensions, window frame connections, and structural fixings. Each bridge is quantified by its linear thermal transmittance, the Ψ-value.
A balcony slab that penetrates a 200 mm insulated facade can carry a Ψ-value of 0.80 W/(m·K) — equivalent to removing a 1.2 m² section of insulation from the wall entirely. At scale across a full residential envelope, unaddressed thermal bridges routinely add 15–40% to the calculated heat loss figure.
BIM-specific workflow for Ψ-value management:
- Flixo integration (2D thermal bridge calculation): Exports junction geometries from Revit/ArchiCAD into Flixo Pro for ISO 10211-compliant Ψ-value calculation — outputs feed back into the BIM energy model as linear heat loss coefficients
- IFC-based junction tagging: Each structural connection in the BIM model is tagged with its Ψ-value; the energy model aggregates total linear thermal bridging loss (W/K) across all tagged junctions automatically
- Passive House Planning Package (PHPP) connection: For Passive House-target projects, BIM models export geometry and U-values directly into PHPP via Rhino.Inside or manual IFC extraction, allowing the PHPP thermal bridge catalog to be populated from model data rather than manual measurement
So what? A home designed to 0.15 W/(m²K) average U-value that ignores thermal bridging may perform at an effective 0.24 W/(m²K) when bridges are counted — a 60% penalty on envelope performance that no amount of renewable energy specification can fully offset.
Thermal Metric 4: Airtightness Target (ACH50)
Unit: Air Changes per Hour at 50 Pascals pressure differential
Airtightness is the thermal metric that BIM software addresses most indirectly — but most powerfully. ACH50 is measured physically by a blower door test after construction. But BIM software is the tool that makes a sub-1.0 ACH50 target achievable by coordinating the airtightness layer across every trade before a single gap forms.
The problem in traditional residential construction: the airtightness membrane is designed by the architect, penetrated by the mechanical engineer for HVAC penetrations, cut by the electrician for cable entries, and patched inconsistently by the general contractor. Each uncoordinated penetration is a pressure leak. In a code-minimum US home, ACH50 values of 5.0–7.0 are common. A Passive House target is ≤ 0.6 ACH50 — a threshold that, once achieved, creates the stable airtight shell that makes smart home automation in a Passive House genuinely effective rather than a bandage over an uncontrolled envelope.
BIM workflow closes this gap through:
- MEP coordination model: All mechanical, electrical, and plumbing penetrations modeled in 3D within the BIM environment — clash detection (Navisworks Manage or Revit-native) identifies every location where a service crosses the airtightness plane before construction
- Airtightness plane as a BIM element: The membrane is modeled as a dedicated BIM layer — not assumed — with explicit penetration schedules that contractors receive as coordinated shop drawings
- Prefabrication integration: BIM models export geometry to CNC cutting files for pre-cut airtight membrane panels and prefabricated structural insulated panels (SIPs), allowing factory quality control over the airtightness layer rather than site-condition patching
A project in Gothenburg, Sweden — a 3-bedroom residential passive retrofit completed in 2023 — used a BIM-coordinated airtightness strategy to achieve 0.43 ACH50 on blower door test, against a design target of 0.5 ACH50. The BIM model identified 47 uncoordinated service penetrations in pre-construction clash detection that would each have required site-condition sealing under a traditional workflow.
Thermal Metric 5: Peak Thermal Load (W/m² Heating / Cooling)
Unit: W/m² of conditioned floor area, split by heating and cooling season
Peak load is the thermal metric that sizes the HVAC system — and in sustainable home design, right-sizing is everything. An oversized heat pump cycles on and off inefficiently, degrading COP (coefficient of performance) and shortening equipment life. An undersized system fails on design days. A correctly BIM-calculated peak load results in a system that runs at 80–95% of rated capacity under design conditions — the operating point at which efficiency is highest.
BIM calculates peak heating and cooling loads through:
- Revit Heating and Cooling Loads tool: ASHRAE Handbook-F-based load calculation using room-by-room geometry, constructions, occupancy schedules, and ventilation rates pulled directly from the model — no re-entry of data
- Design day weather files: Peak load calculations use ASHRAE 99% heating design day and 1% cooling design day weather data for the specific location, not generic regional averages
- Internal gain modeling: Occupancy, lighting power density, and appliance loads are modeled by room and schedule — a home office operating 9 hours/day creates a meaningfully different internal gain profile than a bedroom, and BIM captures this at room level
So what? In a 180 m² sustainable home designed for Copenhagen’s climate, BIM-calculated peak heating load using a correctly configured thermal envelope typically lands between 10–15 W/m² — compared to 35–50 W/m² for a code-minimum structure in the same location. That difference determines whether you install a 3 kW heat pump or an 8 kW unit. The cost difference in equipment, installation, and lifetime energy is substantial — and the BIM model surfaces it at design stage, not commissioning.
Comparative Analysis: BIM Workflow vs. Industry Standard
How Residential Sustainable Design Gets Done Today (The Problem)
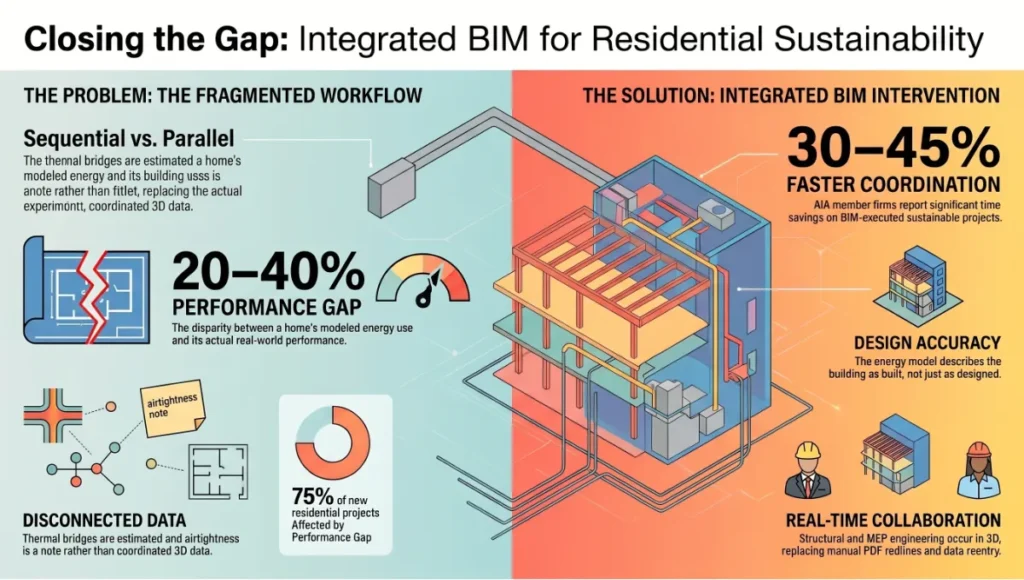
The standard residential sustainable home workflow in 2025 still operates in sequence rather than in parallel:
- Architect produces CAD or basic 3D geometry
- Energy consultant receives drawings, manually inputs data into EnergyPlus or REM/Rate
- Structural engineer works in a separate file
- MEP engineer coordinates via PDF redlines
- Energy report arrives at design development — too late for major thermal envelope changes without fee implications
- Thermal bridges are estimated rather than calculated
- Airtightness is specified in a note, not coordinated in 3D
Result: The energy model describes the building as designed, not the building as built. Performance gaps of 20–40% between modeled and actual performance are common — a phenomenon documented in the UK’s Zero Carbon Hub “Performance Gap” report as affecting over 75% of new residential projects studied. The American Institute of Architects (AIA) has similarly documented BIM adoption as the primary workflow intervention reducing this gap in residential practice, with member firms reporting coordination time reductions of 30–45% on BIM-executed sustainable projects.
The BIM Workflow Replacement
| Decision Point | Standard Workflow | BIM Workflow |
|---|---|---|
| EUI check | Post-design, external consultant | Real-time, designer-controlled |
| Thermal bridge calculation | Estimated or omitted | Coordinated junction-by-junction |
| SHGC optimization | Single value, all facades | Per-elevation, per-season |
| HVAC sizing | Post-design load calculation | Automated from model geometry |
| Airtightness coordination | Specification note | 3D clash detection, penetration schedule |
| Data entry | Manual, repeated across tools | Single-source BIM model, federated |
The BIM workflow does not add steps — it moves analytical steps earlier in the process where they create value rather than additional cost.
Concept Project Spotlight
Speculative / Internal Concept Study — Thermal Grid House by Nuvira Space
Project Overview
Location: Outskirts of Copenhagen, Denmark — latitude 55.68°N, continental climate zone
Typology: 2-storey single-family sustainable home, 220 m² gross floor area
Vision: A residence where every architectural decision — from structural bay spacing to window sill depth — is derived from thermal performance data outputs rather than stylistic convention. The building’s form is the solution to its energy equation.
Design Levers Applied
Envelope Strategy
- External wall: 400 mm triple-stud timber frame with mineral wool (R-60 / RSI-10.5), continuous exterior insulation board 80 mm (XPS), targeting U-value of 0.09 W/(m²K) across the opaque envelope
- Roof: 600 mm loose-fill cellulose in attic zone, U-value 0.07 W/(m²K)
- Foundation: 300 mm EPS under slab, thermal break at perimeter using Schöck Isokorb type KXT elements (Ψ-value 0.034 W/(m·K) per unit)
- Airtightness target: 0.4 ACH50 — all service penetrations pre-coordinated in BIM clash detection
Glazing Configuration
- South facade: Triple-glazed units, SHGC 0.52, U-value 0.70 W/(m²K), fixed overhang depth of 550 mm calculated for 55.68°N latitude
- North facade: Triple-glazed, SHGC 0.32 (minimal solar gain orientation), U-value 0.60 W/(m²K)
- East/West: SHGC 0.28 with operable external aluminium louvers — BIM-modeled to provide 85% shading factor at summer peak sun angles
- Total WWR (window-to-wall ratio): 28% south / 12% north / 10% east-west
Mechanical Systems
- Air-to-water heat pump: 5 kW rated output (derived from BIM peak heating load calculation of 11.3 W/m² × 220 m² = 2,486 W design load; 5 kW selected for DHW and backup capacity)
- MVHR (mechanical ventilation with heat recovery): 90% thermal efficiency, flow rate 0.3 l/s/m² at occupied hours
- PV array: 14 × 400W panels (5.6 kW peak), south roof at 35° tilt — BIM solar radiation analysis confirmed 1,050 kWh/kWp annual yield for Copenhagen latitude
BIM Thermal Simulation Outputs
- Modeled annual EUI: 18.4 kWh/m²/yr (heating + cooling combined)
- Peak heating load: 11.3 W/m²
- Peak cooling load: 6.8 W/m²
- ACH50 target: 0.4
- Total Ψ-value contribution to heat loss: 3.2% of total transmission loss (all junctions calculated, not estimated)
Transferable Takeaway
The Thermal Grid House is not a luxury experiment. Every lever applied — the overhang depth formula for latitude, the per-elevation SHGC strategy, the Schöck thermal break specification, the MVHR sizing from BIM ventilation load — is replicable on any residential project where the architect controls the BIM environment from schematic design onward. The size of the budget is less relevant than the point in the design timeline when the thermal analysis begins. Begin at day 1. The numbers change everything.
Intellectual Honesty: Current Limitations
BIM software for sustainable home design is not a solved problem. The honest account of where it falls short:
Interoperability gaps remain real. The IFC open standard (IFC4 ADD2, IFC4X3) has improved data exchange between platforms, but energy model fidelity is frequently lost in translation between Revit, ArchiCAD, and external simulation engines. U-values transfer; complex material layering often does not.
Residential-scale adoption lags commercial. The BIM tools calibrated for sustainable performance — IES VE, One Click LCA, Flixo — carry annual license costs of $2,000–$12,000+. For a small residential architecture practice designing 6–10 homes per year, the ROI calculus is harder than for a commercial firm.
As-built divergence is still the norm. BIM produces a design model. The as-built model — reflecting actual construction — requires dedicated BIM management on site. On most residential projects, that resource does not exist. The performance gap between BIM-modeled and post-occupancy measured EUI remains 15–25% on average even in BIM-executed projects, according to 2024 data from the Chartered Institution of Building Services Engineers (CIBSE).
Occupant behavior is not simulatable. A home modeled for 2 occupants with standard ASHRAE occupancy schedules will perform differently than the same home occupied by 4 people who cook 3 meals per day and open windows in January. BIM’s thermal accuracy ends at the design boundary.
2030 Future Projection
The convergence of 3 technology trajectories will redefine BIM software for sustainable home design by 2030:
1. Real-time digital twins at residential scale. IoT sensor networks (temperature, CO₂, humidity, occupancy) feeding live data back into a cloud-hosted BIM model will close the performance gap between modeled and actual behavior. Tools like Autodesk Tandem and Willow are already operational in commercial projects; residential adaptation is the next frontier, likely entering the mid-tier market by 2027–2028. For a deeper look at how this technology is already reshaping building operations, Nuvira Space’s guide to digital twin building management covers the current state of the technology in detail.
2. Generative AI-driven thermal optimization. AI tools embedded in BIM environments — already demonstrated in Autodesk Forma’s site analysis module and Spacemaker’s massing optimizer — will evolve to simultaneously optimize the 5 thermal metrics described in this guide against a homeowner-defined constraint set (budget, program, aesthetics) in under 60 seconds. The architect’s role shifts from thermal analyst to design curator of algorithmically generated performance solutions.
3. Material passport integration. By 2030, BIM models in the EU will be legally required to carry material passports for building permit applications in several jurisdictions (Netherlands pilot already operational as of 2024). Each material in the BIM environment will carry cradle-to-grave embodied carbon data from verified Environmental Product Declarations (EPDs), allowing real-time lifecycle carbon calculation alongside operational energy modeling. The 5 thermal metrics described here will be joined by a 6th: embodied carbon per m² at design stage.
The Toolset: 5 Key Tools for BIM-Driven Sustainable Home Performance
1. Autodesk Revit + Autodesk Insight The dominant BIM authoring platform for residential sustainable design in North America and internationally. Insight provides integrated solar, lighting, and energy analysis directly within the Revit environment. Best for: teams already in the Autodesk ecosystem; projects targeting LEED or ASHRAE 90.1 benchmarks.
2. Graphisoft ArchiCAD + EcoDesigner Star ArchiCAD’s native sustainability extension provides IFC-compliant energy analysis without leaving the authoring environment. Particularly strong for European residential projects targeting EN ISO 13790 calculation methodology. Best for: smaller architectural practices, residential specialists, European regulatory contexts.
3. IES Virtual Environment (IES VE) The simulation engine of choice for high-accuracy dynamic thermal modeling. Accepts IFC import from any BIM platform. Uses actual meteorological year (AMY) weather data for climate-resilient analysis. Best for: Passive House-target projects, any project where modeled vs. actual performance gap minimization is the explicit goal.
4. One Click LCA Lifecycle carbon assessment integrated with BIM data. Accepts Revit, ArchiCAD, SketchUp, and IFC inputs. Generates EPD-verified embodied carbon calculations alongside operational energy figures. Best for: projects targeting net-zero whole-life carbon; EU Taxonomy-aligned sustainable finance requirements.
5. Flixo Pro ISO 10211-compliant 2D thermal bridge calculation tool. Accepts geometry exports from BIM authoring platforms. Outputs Ψ-values and isothermal maps for every structural junction in the thermal envelope. Best for: any Passive House project; any project where thermal bridging is calculated rather than assumed.
Comprehensive Technical FAQ
Frequently Asked Questions: BIM Software for Sustainable Home Design
Q: Can I use BIM software for a small residential project, or is it only for large-scale construction?
A: BIM software scales to residential projects of any size. Tools like ArchiCAD and the free academic version of Revit LT are used on single-family homes under 100 m². The 5 thermal metrics discussed in this guide are equally applicable to a 90 m² terraced house as to a 350 m² custom residence. The thermal analysis workflow — EUI, SHGC, Ψ-value, ACH50, peak load — does not require a large project to generate meaningful data. In fact, the ROI on BIM-driven thermal optimization is proportionally higher on smaller homes where HVAC system cost represents a larger fraction of the total build budget.
Key specs for small residential BIM adoption:
- ArchiCAD Solo (single license): ~$2,200/year, includes EcoDesigner Star
- Autodesk Revit LT: ~$670/year (no energy analysis native — requires Insight add-on)
- IES VE Residential module: Available as reduced-scope license for projects under 500 m²
Q: What is the difference between a BIM energy model and a standard energy calculation?
A: A standard residential energy calculation (e.g., REM/Rate in the US, SAP in the UK) is a steady-state calculation — it uses fixed average conditions to estimate annual energy use. It does not simulate hour-by-hour thermal behavior, does not account for thermal mass time lag, and is typically run once after design is complete.
A BIM energy model is a dynamic simulation:
- It calculates energy performance for every hour of an 8,760-hour annual cycle
- It uses actual weather data (TMY or AMY files) for the building’s specific location
- It updates automatically when the design changes — wall thickness, window size, roof assembly
- It separates heating, cooling, ventilation, DHW, and plug loads rather than combining them into a single figure
The difference in output accuracy is substantial. Dynamic BIM simulation typically predicts actual energy consumption within 10–18% of post-occupancy measured performance when occupancy assumptions are correctly calibrated. Standard steady-state calculations routinely diverge by 30–50%.
Q: How does BIM software help me hit a LEED or Passive House certification?
A: Both certification frameworks require documented performance evidence at specific thresholds. BIM software automates the documentation burden while optimizing toward the threshold:
For LEED v4.1 / v5 (residential):
- EA Credit: Optimize Energy Performance — BIM energy model (IES VE, eQUEST via export, or Revit Insight) generates the ASHRAE 90.1-2019 baseline comparison required for credit compliance
- SS Credit: Site Assessment — BIM-linked solar analysis tools generate the solar radiation documentation for renewable energy potential credits
- MR Credit: Building Life-Cycle Impact Reduction — One Click LCA or Tally (Revit plugin) generates the embodied carbon documentation
For Passive House (PHPP):
- BIM model exports to PHPP via IFC or manual data extraction: floor areas, opaque U-values, window U-values and SHGC per orientation, thermal bridge Ψ-values, ventilation air volumes
- PHPP heating demand threshold: ≤ 15 kWh/(m²a) or peak heating load ≤ 10 W/m²
- PHPP airtightness requirement: ≤ 0.6 ACH50 (Classic) / ≤ 1.0 ACH50 (Plus/Premium)
Q: Which of the 5 thermal metrics has the highest impact on a home’s energy bill?
A: In a cold-climate sustainable home (Köppen classification Dfb or Cfb — applicable to cities including Copenhagen, Vancouver, Zurich, and Melbourne’s highlands), the ranked impact order is typically:
- Annual EUI — the composite outcome metric; reducing it from 45 to 20 kWh/m²/yr on a 200 m² home saves ~5,000 kWh/year
- Airtightness (ACH50) — reducing from 5.0 to 0.6 ACH50 can account for 20–30% of the total heating load reduction
- Thermal bridging (Ψ-value) — typically 15–40% of total transmission heat loss in poorly detailed envelopes; elimination is a direct EUI reduction
- Peak thermal load — drives HVAC equipment cost; right-sizing saves $3,000–$8,000 in upfront equipment cost and improves lifetime system COP
- SHGC at facade level — highest impact in mixed climates where both heating and cooling seasons are significant
In hot-climate designs (Köppen BWh, Csa — applicable to cities like Phoenix, Seville, or Riyadh), the ranking shifts: SHGC moves to position 1, ACH50 to position 2, and heating-related Ψ-value drops in relative importance.
Q: Do I need to hire a BIM specialist, or can the architect run the thermal analysis?
A: In 2025, the competency gap is closing. ArchiCAD’s EcoDesigner Star and Revit’s Insight tool are designed for architect-operated energy analysis — not specialist-only. An architect with 8–12 hours of platform-specific training can run credible EUI benchmarking, solar radiation analysis, and basic peak load calculations without external consultant support.
The boundary where a specialist adds value:
- Passive House PHPP verification: Requires PHPP-trained certifier
- Detailed dynamic simulation (IES VE, EnergyPlus): Benefits from MEP or simulation specialist input on HVAC system modeling
- Ψ-value calculation (Flixo): Requires thermal bridge calculation competency — typically a building physics specialist or facade engineer
- Embodied carbon LCA (One Click LCA): Can be architect-operated but requires careful EPD data selection
- For a standard sustainable home targeting 30–40% better-than-code performance, architect-operated BIM thermal analysis is fully sufficient. For Passive House or net-zero certification, budget for a building physics consultant at schematic design stage — approximately 1.5–3% of construction cost.
Your Home’s Thermal Performance Is Decided at Month 1 — Not at Handover
The 5 thermal metrics in this guide — EUI, SHGC, Ψ-value, ACH50, and peak load — are not post-design audit points. They are design inputs. And BIM software is the only environment that makes them visible at the moment when changing them costs nothing except a parameter update.
If you are a homeowner, ask your architect to show you the EUI benchmark on the schematic model before design development begins. If you are an architect, the question is not whether to integrate thermal BIM analysis — it is how early in your next project you will run the first energy simulation. If you are a developer, understand that the performance gap between a home designed with BIM thermal analysis and one designed without it will be measurable, documented, and increasingly visible to buyers who know what to look for.
The thermal envelope is not a construction detail. It is the primary design decision of a sustainable home. BIM software makes it one you can optimize before it is too late to change.
Explore more Future Tech analysis from Nuvira Space and see how the next generation of design tools is redefining what homes can achieve — thermally, structurally, and experientially.
© Nuvira Space — All rights reserved. | Future Tech Series | All specifications cited are based on ASHRAE 90.1-2019 energy standards, ISO 10211 thermal bridge methodology, Passive House Institute PHPP v10 documentation, CIBSE TM54 post-occupancy evaluation data (2024), and published software documentation from Autodesk, Graphisoft, IES Ltd., One Click LCA, and Nemetschek Group. The Thermal Grid House is a speculative internal concept study and does not represent a completed project.