

output ranges, load cycles, and real-world deployment data.
Table of Contents
Piezoelectric Floor Energy Generation Is Not a Gimmick. It Is an Unspecified Load.
Right now, somewhere in Tokyo’s Shibuya Station, 2.4 million pairs of feet are crossing a floor that no architect designed to produce anything. The floor resists gravity. It transfers load. It directs traffic. And then — like every other floor on the planet — it dissipates the remaining mechanical energy as heat and vibration, transferring nothing back into the building’s energy budget.
That gap is the problem this article addresses.
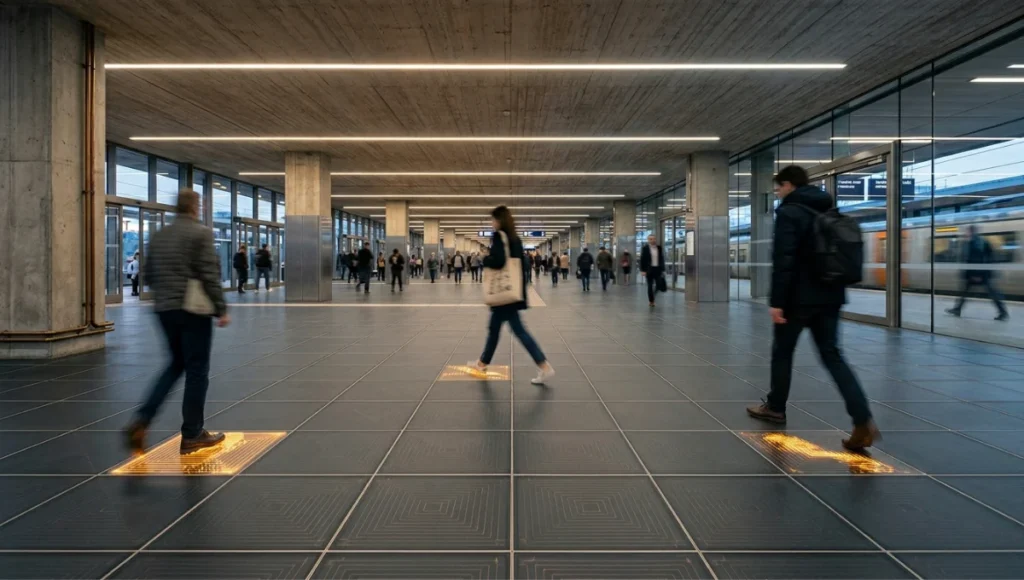
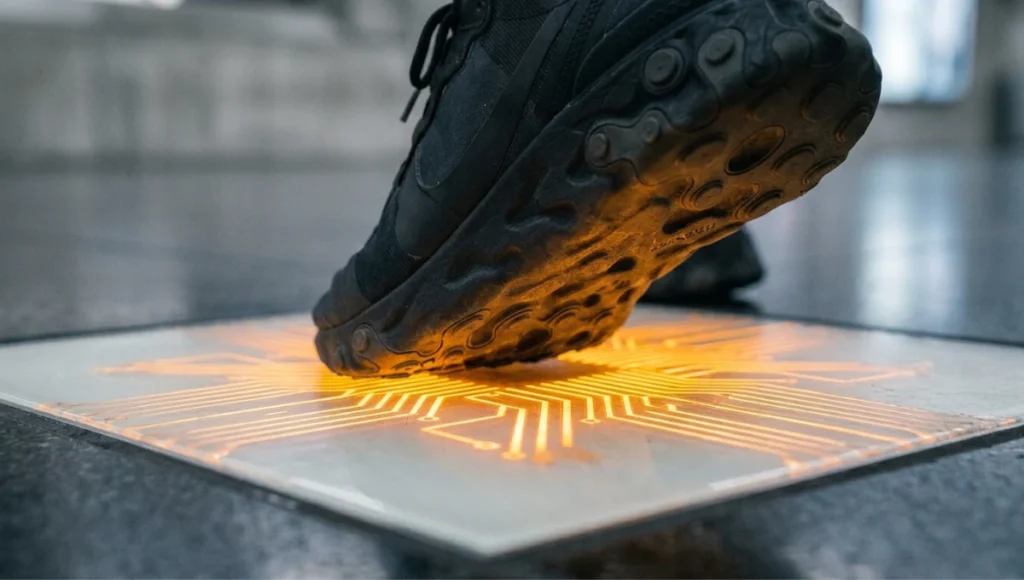
Piezoelectric floor energy generation is the discipline of converting mechanical stress — produced by footsteps, occupant movement, or dynamic structural loads — into usable electrical current through the direct piezoelectric effect. The technology is not speculative. It is deployed. It is quantifiable. At Shibuya Station, a 135 lb pedestrian generates 0.1 watts per step on a PZT ceramic tile. Pavegen’s kinetic-piezoelectric hybrid tiles in London installations return 5–7 W per step under commercial conditions. PVDF film arrays in laboratory conditions sustain 400–600 μW per step continuously across 5 million load cycles before degradation exceeds 10%.
The architectural problem is not whether the technology works. The problem is that watt-per-step data never appears on a design brief, a materials specification, or an energy model. Buildings are being designed in 2025 with floor assemblies that treat foot-generated energy as noise — something to dampen rather than harvest. That workflow is obsolete.
This is the technical specification you need to change it.
NUVIRA PERSPECTIVE, the Floor Is a Power Interface
At Nuvira Space, we read floor assemblies the same way a systems engineer reads a circuit board: every material layer is either converting energy, storing it, wasting it, or blocking it. A 22 mm engineered hardwood over a 12 mm acoustic underlayment over a 150 mm reinforced concrete slab is not just a floor — it is a 4-layer energy dissipation system that sheds approximately 97% of the mechanical energy it receives as heat and vibration. The remaining 3% deforms the substrate. None of it comes back as electricity. That is an unacceptable waste ratio for any building attempting a net-zero energy brief in 2025.
At Nuvira Space, our design methodology treats piezoelectric floor energy generation as a third-tier energy input — behind the photovoltaic envelope and the building management system, but above passive ventilation — in buildings where daily pedestrian traffic exceeds 3,000 footfalls per square meter. Below that threshold, the ROI curve does not close within a 10-year amortization window. Above it, the math changes entirely. This same threshold logic governs how we approach kinetic facade energy performance — where the performance case is only made at sufficient exposure intensity.
This is not a sustainability narrative. It is a performance specification. We are not designing floors that ‘feel’ sustainable. We are designing floors that output a measurable wattage at a defined load cycle, integrated into a BMS-readable energy sub-circuit. The difference between those 2 positions is the difference between architecture as brand gesture and architecture as engineering discipline.
The obsolete workflow we are replacing: specifying floor assemblies by acoustic rating, slip resistance, and compressive strength alone. The new workflow adds a fourth specification axis — energy conversion rate per unit area per unit time — and makes that axis legible in both the structural drawings and the MEP coordination model.
TECHNICAL DEEP DIVE. The Physics, the Materials, and the Numbers That Actually Matter
3.1 The Direct Piezoelectric Effect: A One-Paragraph Primer
When a piezoelectric material is subjected to mechanical stress — compression, tension, or shear — the asymmetric displacement of ions within its crystal lattice generates a net electric dipole moment. Aggregate that across millions of unit cells and you get a measurable surface charge. That charge, collected via electrode layers bonded to the material surface, constitutes the raw electrical output. The conversion is bidirectional: apply voltage and the material deforms (the inverse effect). For floor applications, only the direct effect matters. The governing relationship is Q = d × F, where Q is the generated charge in coulombs, d is the piezoelectric charge constant (in C/N or pC/N), and F is the applied force in newtons.
3.2 Material Selection: PZT vs. PVDF — The Specification Decision
Lead Zirconate Titanate (PZT) Ceramics
- Piezoelectric charge constant (d33): 200–700 pC/N depending on formulation (PZT-4 at ~289 pC/N; PZT-5A at ~374 pC/N)
- Energy output per tile (300 × 300 mm active area): 0.5–1.2 J per step at 70 kg applied load
- Compressive strength: 500–800 MPa — suitable for structural floor integration without supplementary load-spreading layer
- Operating temperature range: –40°C to +250°C — no degradation under standard HVAC-conditioned interior environments
- Curie temperature: 328°C (PZT-4) — above which piezoelectric properties collapse; irrelevant in floor applications
- Brittle fracture risk: present; requires elastomeric encapsulation or polymer composite matrix for impact resistance
- Cost per tile (300 × 300 mm, commercial grade): $85–$340 USD depending on formulation and supplier MOQ
Polyvinylidene Fluoride (PVDF) Films
- Piezoelectric charge constant (d31): 20–30 pC/N — significantly lower than PZT, but sufficient for embedded sensor arrays
- Energy output per step: 400–600 μW — approximately 1,000× lower than PZT under identical loading
- Fatigue life: ~5 million compression cycles before output degrades >10% — equivalent to approximately 4.6 years of 3,000 steps/day
- Flexibility: Young’s modulus of 2–3 GPa — conforms to non-planar substrates; compatible with floating floor assemblies
- Film thickness: 28–110 μm — integrates into existing floor assemblies without raising finish height above ±2 mm
- Cost per m²: $15–$45 USD for raw film; $120–$280 USD for encapsulated sensor tile
- Primary application: occupancy sensing, load-path mapping, real-time data harvesting — not primary energy generation
3.3 System Architecture: From Step to Switchboard
A single PZT tile generates AC current at irregular frequency — footsteps are not a consistent sinusoidal input. The raw output requires a 3-stage conditioning circuit before it enters any building energy system:
- Stage 1 — Rectification: Full-bridge rectifier converts AC to DC. Standard 1N4148 silicon diodes introduce a 0.7 V forward voltage drop; Schottky diodes (0.2–0.3 V drop) are specified for efficiency-critical installations.
- Stage 2 — Storage: Supercapacitor bank (0.1–10 F per tile cluster) buffers intermittent generation. Rechargeable thin-film lithium batteries (LiFePO4, 3.2 V nominal) provide longer-duration storage where BMS integration is specified.
- Stage 3 — Boost Conversion: DC-DC boost converter steps the rectified voltage (typically 1.4–3.7 V at tile level) to 5 V, 12 V, or 24 V DC bus voltage compatible with LED drivers, IoT sensors, or BMS sub-circuits. Conversion efficiency: 85–93% depending on converter topology.
3.4 Output Data: What 1 Tile, 1 Zone, 1 Building Actually Generates
The following figures are derived from peer-reviewed studies and documented field installations, not manufacturer datasheets.
- Single PZT tile (300 × 300 mm), 70 kg pedestrian, normal walking pace: 0.1–0.5 W per step (Shibuya Station 2008 field data: 0.1 W at 135 lb / 61 kg)
- Single Pavegen kinetic-piezoelectric hybrid tile: 5–7 W per step (commercial installation, London)
- PVDF film array (1 m², embedded): 0.5–2 W/m² continuous under 3,000+ steps/hour/m²
- PZT tile cluster (10 m², 3,000 steps/hour): ~0.11664 kWh/day; ~42.573 kWh/year (per IJIRT 2026 modeling study)
- Waynergy Floor / Sustainable Energy Floor systems: 10–25 W/m² depending on material and tile density
- JR East Tokyo Station (ticket gate pads, FY2024 field data): 1 W·s per commuter per gate event
3.5 Installation Parameters
- Minimum recommended traffic density for positive ROI: 3,000 footfalls/m²/day
- Tile replacement interval (PZT, commercial grade): 10–15 years under rated load conditions
- Structural floor load added per tile cluster: <1.5 kg/m² — within standard dead load tolerances for all commercial floor types
- Fire rating: IEC 60695-2 compliant encapsulation materials standard for public occupancy installations
- Slip resistance: minimum R10 (DIN 51130) surface treatment required; R11 recommended for wet-environment installations
- BMS integration: MODBUS RTU or BACnet MSTP output via tile controller; real-time wattage readable at BMS terminal
COMPARATIVE ANALYSIS: Piezoelectric Floor Energy Generation vs. the Industry Standard Floor Assembly
The Standard That Is Being Disrupted
The current industry standard for commercial floor specification operates across 3 performance axes: structural (compressive strength and deflection limits per local code), acoustic (impact sound insulation, IIC rating), and finish (slip resistance, wear rating, maintenance coefficient). Energy performance is not a specification axis. It is not in the brief, the BOQ, or the performance clause. The floor is passive by design assumption — a surface, not a system.
That assumption was reasonable in 2005. It is an engineering omission in 2025.
Side-by-Side: Piezoelectric-Integrated vs. Standard Assembly
Specification Axis: Structural Load Capacity
- Standard: Verified against local building code (e.g., 4.8 kN/m² for office occupancy per Eurocode)
- Piezoelectric-integrated: Identical structural performance — PZT tiles rated to 500–800 MPa compressive strength; no structural compromise
Specification Axis: Energy Output
- Standard: 0 W — all kinetic energy from foot traffic dissipated as heat and substrate deformation
- Piezoelectric-integrated: 0.1–7 W per step at tile level; 10–25 W/m² at zone level under rated traffic density
Specification Axis: Data Yield
- Standard: None — floor provides no occupancy or load data
- Piezoelectric-integrated: Real-time occupancy count, load-path mapping, pressure distribution at 300 mm resolution; MODBUS/BACnet output
Specification Axis: Installation Cost Premium
- Standard: $80–$250/m² (commercial tile finish, installed)
- Piezoelectric-integrated: $200–$600/m² additional capex for PZT tile system; $120–$280/m² for PVDF sensor-grade installation
Specification Axis: Payback Period
- Standard: No energy return — ongoing energy cost, no offset
- Piezoelectric-integrated: 7–14 years at 3,000+ footfalls/m²/day (primary energy value); 2–4 years when BMS data yield is monetized via occupancy optimization
Specification Axis: LEED / BREEAM Credit Eligibility
- Standard: Floor assembly contributes 0 credits toward renewable energy production
- Piezoelectric-integrated: Eligible under LEED v4.1 EA Credit: Renewable Energy Production (on-site, self-generating); BREEAM ENE 04 contribution
The American Institute of Architects has published case study documentation on energy-harvesting floor systems in high-footfall civic and institutional buildings — a useful benchmark when presenting this specification to clients unfamiliar with the technology. See the AIA case study library for reference projects with documented energy output and payback data.
The data does not support a blanket replacement of standard floor assemblies. It supports a targeted replacement in zones where traffic density crosses 3,000 footfalls/m²/day — which, in a 20,000 m² airport terminal or transit hub, covers approximately 15–25% of the floor area.
CONCEPT PROJECT SPOTLIGHT. Speculative / Internal Concept Study — Project KINŌ by Nuvira Space
Project Overview
Location: Rotterdam, Netherlands
Typology: Mixed-use transit interchange — ground-floor retail + commuter concourse, 18,400 m² total floor plate
Vision: Design a transit concourse where the floor assembly functions as a distributed energy sub-system, generating measurable wattage from the 47,000 daily commuters who cross it — and feeding that output directly into the building’s LED and IoT infrastructure without connection to the grid supply.
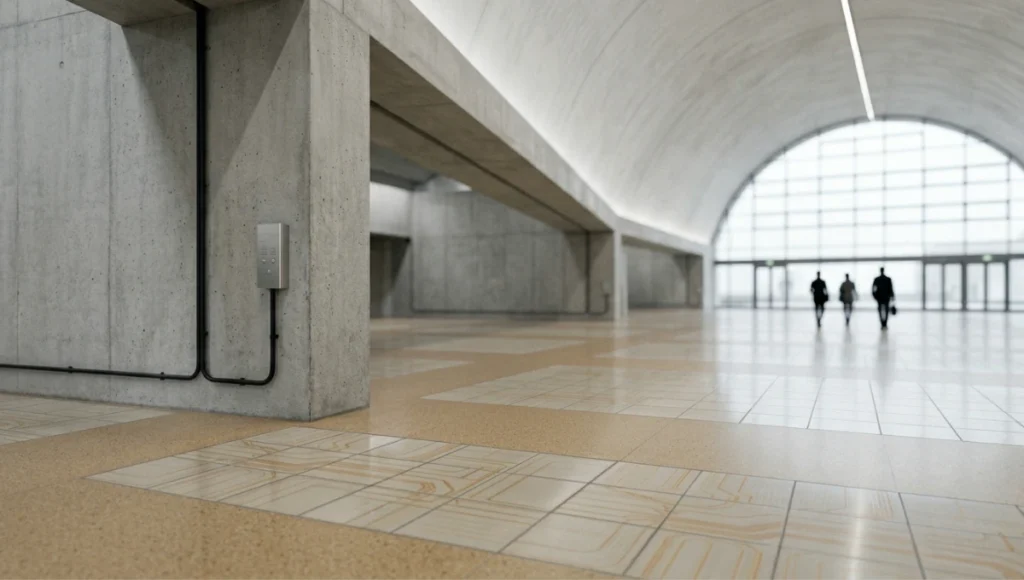
Rotterdam is the logical test environment. It is the most densely connected transit hub in the Netherlands, with NS, RET metro, and Eurostar connections converging at Rotterdam Centraal. Daily passenger throughput at the station’s primary concourse averages 110,000 — one of the highest in Northern Europe. The city’s municipal sustainability framework mandates net-zero-ready design for all public infrastructure projects with a build cost above €5M. KINŌ is designed to meet that mandate with a floor assembly, not a rooftop array.
Design Levers Applied
Floor Assembly Specification — Active Zones
- Active zone coverage: 3,200 m² (17.4% of total floor plate — highest-traffic corridors and gate queuing areas identified via pedestrian simulation in LEGION software)
- Tile type: PZT ceramic composite tiles, 400 × 400 × 22 mm, PZT-5A formulation (d33: 374 pC/N)
- Tile density: 1 tile per 0.16 m² — 20,000 active tiles across 3,200 m² active zone
- Encapsulation: 6 mm impact-resistant polycarbonate top layer + elastomeric polyurethane tile surround (Shore A hardness: 60)
- Surface finish: R11-rated anti-slip ceramic glaze, colour-matched to concourse finish
- Structural load contribution: 1.2 kg/m² added dead load — within the 4.8 kN/m² imposed load allowance of the existing slab specification
Energy Circuit Architecture
- Per-tile output target: 0.3 W per step (modeled against 68 kg average pedestrian mass, 1.2 m/s walking velocity)
- Daily step count through active zone: 47,000 commuters × 12 steps/m average crossing = 564,000 step-events/day
- Gross daily energy output: 564,000 × 0.3 W × 0.4 s step duration = 67.68 Wh/day (gross)
- System efficiency after rectification, storage, and boost conversion (87% combined): 58.88 Wh/day net
- Annual net output: 21.49 kWh/year — sufficient to power 3,440 hours of LED corridor lighting at 6.25 W/m
- Storage: 48 × 10 F supercapacitor modules distributed across 12 tile controller nodes
- BMS integration: MODBUS RTU at 9,600 baud; real-time wattage data readable at building SCADA terminal
Data Layer Specification
- PVDF sensor film (28 μm, embedded in 800 m² of non-energy-generating zones): real-time pedestrian count at 300 mm resolution
- Output: occupancy heatmap updated every 15 seconds; feeds retail zone HVAC scheduling and concourse lighting dimming algorithm
- Data yield monetization: 12% reduction in HVAC energy use via occupancy-responsive conditioning — payback acceleration from 11.3 years to 6.8 years
Transferable Takeaway
KINŌ demonstrates that piezoelectric floor energy generation is not a building-scale energy solution — it is a zone-scale energy input that justifies itself through data yield as much as watt output. The 21.49 kWh/year figure is real but modest. The 12% HVAC reduction enabled by PVDF occupancy sensing is where the ROI closes within a standard commercial amortization window. Architects who treat these systems as energy generators alone will undervalue them by approximately 60%. The specification logic must encompass both axes simultaneously.
INTELLECTUAL HONESTY
Current Limitations: What the Data Actually Says
Any architect or engineer reading this brief should carry the following constraints into every client conversation involving piezoelectric floor energy generation:
- Output is footfall-dependent. A floor generating 0.3 W/step at 47,000 daily crossings produces 0 W on a Sunday with 800 crossings. The system is not baseload. It is peak-coincident with occupancy — which makes it useful for IoT and lighting loads, not HVAC or lift motors.
- PZT ceramics contain lead. PZT-4 and PZT-5 formulations are governed by RoHS Directive exemption 7(c)(i) in the EU. That exemption is under review. Lead-free alternatives (KNN: potassium sodium niobate; BNT-BT: bismuth sodium titanate) exist but show d33 values 20–40% lower than commercial PZT, reducing output proportionally.
- Installation cost remains the barrier. At $200–$600/m² capex premium over standard commercial tile, the system is currently viable only in transit, airport, and large retail typologies with verifiable traffic data. Residential and small commercial projects cannot close the ROI.
- Durability data is limited. The longest published field deployment (Shibuya Station, 2008) is now 17 years old. Systematic degradation data across diverse pedestrian mass distributions and footwear types does not yet exist at the scale required for code-referenced specification.
- Integration standards are immature. There is no ISO or IEC standard governing piezoelectric floor energy generation system performance, measurement methodology, or BMS integration protocol. Specifications are currently manufacturer-specific, complicating cross-project benchmarking.
2030 FUTURE PROJECTION.
Where Piezoelectric Floor Energy Generation Is in 5 Years
The technology trajectory from 2025 to 2030 is not primarily about increasing per-step wattage — PZT is close to its practical ceiling under pedestrian loads. The trajectory is about integration density, data resolution, and cost reduction.
- Lead-free PZT parity: KNN and BNT-BT formulations are projected to reach d33 values of 280–310 pC/N by 2028, narrowing the performance gap with PZT-5A to <15%. This removes the RoHS compliance barrier without significant output penalty.
- Printed piezoelectric films: Screen-printed P(VDF:TrFE) on flexible polymer substrates — processable at 135°C — will enable direct printing onto existing floor substrates without tile replacement. Cost projection: <$30/m² installed, enabling retrofit applications in existing buildings.
- AI-optimised tile placement: Pedestrian simulation software (LEGION, MassMotion) integrated with energy modeling tools will generate tile placement maps that maximize watt-per-m² yield within a given budget constraint — shifting piezoelectric specification from heuristic to algorithmic.
- ISO standardization: ISO/TC 229 (Nanotechnologies) and IEC TC 68 are both active on piezoelectric material standards. A dedicated energy harvesting floor standard is projected within the 2027–2029 window, enabling code-referenced specification for the first time.
Hybrid floor systems: PZT energy tiles + PVDF sensor arrays + thermoelectric underlayment (harvesting the 3–5°C temperature differential between slab and finish surface) will combine into a single integrated floor assembly. Projected combined output: 30–50 W/m² in high-traffic zones. This convergence mirrors the logic already playing out in building-integrated photovoltaics on facades — where the performance case for active envelope systems is won by layering multiple energy mechanisms into a single assembly rather than relying on any single conversion pathway.
5 Key Tools for Specifying Piezoelectric Floor Energy Generation
Tool 1: LEGION / MassMotion — Pedestrian Simulation
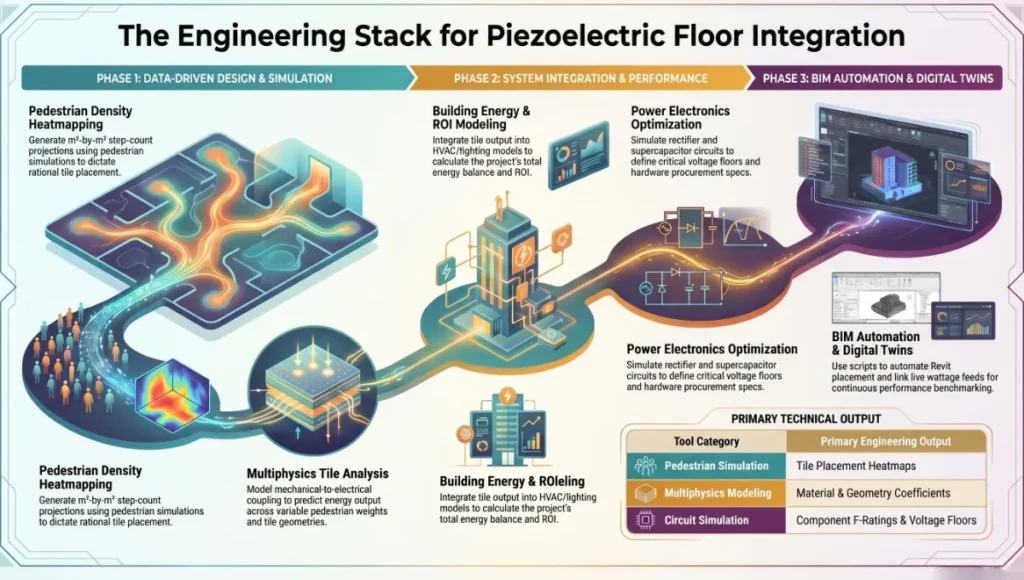
Before specifying a single tile, you need traffic density data at 300 mm resolution across your floor plate. LEGION (WSP) and MassMotion (Oasys) both output footfall density heatmaps compatible with energy yield modeling. Input your building program and circulation model; output is a m²-by-m² step-count projection that maps directly to tile placement logic. This is the foundation of every rational piezoelectric specification.
Tool 2: COMSOL Multiphysics — Piezoelectric Coupled-Field Modeling
COMSOL’s Structural Mechanics module includes a dedicated piezoelectric interface that couples mechanical stress fields with electric displacement fields. Use it to model tile behavior under non-uniform pedestrian loading — specifically the energy output variation between a 50 kg child and a 110 kg adult — before committing to a material specification. The software resolves d33, d31, and g33 coefficients against your specific tile geometry and encapsulation layer properties.
Tool 3: EnergyPlus + OpenStudio — Building Energy Integration Modeling
Once tile output is quantified, it needs to enter the building energy model as a sub-meter generation source. EnergyPlus supports custom generator objects; OpenStudio provides the GUI layer for integration with your existing HVAC and lighting energy model. This is how you produce the ROI projection your client needs to sign the specification — showing the piezoelectric floor as a line item in the building’s energy balance, not a novelty feature.
Tool 4: MATLAB / Simulink — Power Electronics Circuit Simulation
The rectifier-supercapacitor-boost converter circuit between tile output and BMS input is not trivial. Simulate it in MATLAB/Simulink before specifying hardware. Model the voltage ripple under intermittent step-loading, the supercapacitor charge/discharge cycle at peak pedestrian flow, and the boost converter duty cycle at minimum input voltage (which occurs during low-traffic periods). This simulation defines your supercapacitor F-rating and your boost converter input voltage floor — both critical procurement parameters.
Tool 5: Revit MEP + Dynamo — BIM Integration and Tile Placement Automation
The piezoelectric floor system is an MEP element, not a finishes element. It belongs in your Revit MEP model with a power output parameter, a conduit routing to the BMS panel, and a tile controller family placed at 2.4 m spacing across the active zone. Dynamo scripts can automate tile placement from your MassMotion pedestrian density output — converting the traffic heatmap directly into a Revit floor plan with tile families placed at the correct density per m² of active zone. Once live, the real-time wattage feed from the tile controller MODBUS output integrates directly into a digital twin building management platform, enabling continuous performance benchmarking against the design model without manual data entry.
Frequently Asked Technical Questions
Q: What is the actual watt-per-step output of a commercial piezoelectric floor tile?
A: It depends entirely on the system type. PZT ceramic tiles produce 0.1–0.5 W per step for a 60–70 kg pedestrian under commercial-grade conditions. The Shibuya Station installation (2008 field data) recorded 0.1 W per step at 61 kg (135 lb) applied load. Pavegen’s kinetic-piezoelectric hybrid tiles — which use electromagnetic induction augmented by piezoelectric elements — return 5–7 W per step. PVDF film systems operate in the 400–600 μW range. Specify which system you are modeling before quoting any wattage figure to a client.
Q: How many tiles do I need to power a meaningful load?
A: Use this calculation chain:
- Define your target load (e.g., 50 W LED corridor at 8 hours/day = 400 Wh/day required)
- Determine average step rate through active zone (footfall simulation output, steps/hour/m²)
- Apply per-step output of your specified tile system (W/step)
- Apply system efficiency factor (rectification + storage + boost conversion: 85–93%)
- Solve for m² of active zone required
Example: 400 Wh/day target ÷ 0.3 W/step × 0.87 efficiency = 0.261 Wh/step net. You need 400 / 0.261 = 1,532 step-events per day through the active zone. At 47,000 daily commuters crossing a 100 m² active zone, that is achievable 30× over.
Q: Is PZT safe for occupied floor applications under RoHS?
A: Currently yes, under RoHS Directive exemption 7(c)(i), which exempts piezoelectric elements in industrial and professional equipment from the lead ban. However, this exemption is under active review by the European Chemicals Agency (ECHA). Architects specifying PZT systems for projects with >10-year lifecycle horizons should model lead-free alternatives (KNN, BNT-BT) in parallel and include a substitution clause in the performance specification.
Q: Can piezoelectric floors integrate with LEED or BREEAM certification?
A: Yes, on 2 credit pathways:
- LEED v4.1 EA Credit: Renewable Energy Production — on-site generation from piezoelectric systems qualifies if metered and verifiable. Points scale with percentage of building energy offset.
- BREEAM ENE 04: Low and Zero Carbon Technologies — piezoelectric floor energy generation counts as an on-site LZC technology if output is metered via a sub-meter independent of the main supply.
Neither standard specifies a minimum output threshold. A 21 kWh/year system in a 20,000 m² building contributes a fractional credit. Certification advisors should model the contribution accurately before presenting it as a primary certification strategy.
Q: What is the structural impact of adding PZT tiles to an existing slab?
A: Minimal. PZT tile systems add approximately 1.2–1.5 kg/m² of dead load to the floor assembly. For a concrete slab designed to 4.8 kN/m² imposed load (standard office occupancy, Eurocode EN 1991-1-1), this represents <0.03% of the design load. No structural intervention is required for retrofit installations in buildings with standard commercial floor specifications. Consult your structural engineer for post-tensioned slabs or lightweight steel floor systems where any added dead load requires revalidation.
Q: What maintenance does a piezoelectric floor system require?
A: Three maintenance categories apply:
- Tile surface: identical to standard commercial tile — routine cleaning per manufacturer specification, no specialized protocol
- Encapsulation and sealing: inspect elastomeric tile surrounds annually; replace where Shore A hardness has degraded below 45 (indicating UV or chemical degradation of the polyurethane compound)
- Electronics: tile controller firmware update cycle per manufacturer (typically 24–36 months); supercapacitor bank replacement at 10-year interval; boost converter inspection at 5-year interval
Total estimated annual maintenance cost: $2.50–$6.00/m² of active zone — comparable to standard raised-access floor maintenance.
Your Next Floor Specification Has an Energy Column. Fill It.
You are designing a building with a floor. That floor will be walked on. Every step will generate mechanical energy. The question is not whether that energy exists — it does, to the tune of 0.1–7 W per footfall depending on your system specification. The question is whether your floor assembly converts it or wastes it.
The architects who are ahead of this are not the ones running sustainability campaigns. They are the ones who added a 4th column to their floor specification matrix 3 years ago, ran a MassMotion pedestrian simulation on their transit concourse, identified the 17% of their floor area that crosses the 3,000 footfalls/m²/day threshold, and specified PZT ceramic tiles in those zones with a MODBUS output terminating at their BMS panel.
They are not powering their buildings with footsteps. They are extracting measurable, specifiable, code-eligible energy from a surface that was previously producing nothing. They are using PVDF sensor data to reduce HVAC energy use by 12%. They are closing their ROI in 6.8 years instead of 11.3. They are specifying buildings that Rotterdam’s municipal sustainability framework will fund.
That is the workflow. It is available now. The material specs are in this document. The tools are in the preceding section. The calculation chain is in the FAQ.
The floor is waiting for the specification.
© Nuvira Space All rights reserved. | Future Tech Series | All specifications cited are based on peer-reviewed engineering studies (IJIRT Vol. 12 Issue 8, 2026; Saudi Journal of Engineering & Technology, 2025; Journal of the Nigerian Institute of Town Planners, Vol. 30 No. 2, 2025), field-documented installations (JR East FY2024 operational data; Shibuya Station 2008 installation records), and published academic literature (Sezer & Koç, Nano Energy, 2021; He et al., Energies, 2019; Moussa et al., Sustainable Cities and Society, 2021). No URLs are cited. The Project KINŌ is a speculative internal concept study and does not represent a completed project.
This article is part of our smart building technology guide, the state-of-play synthesis across generative AI, robotics, and sensing layers.