

Table of Contents
| KEY TAKEAWAYS. What You Need to Know Before You Read Sponge city infrastructure is a systemic redesign of how cities absorb, retain, and redirect water at the scale of entire districts — not a landscaping trend. Six distinct urban water types demand six distinct engineered responses; conflating them produces infrastructure that fails under the first stress test.Singapore, Rotterdam, and Copenhagen have demonstrated 40–70% reductions in peak stormwater runoff through phased sponge implementation over 10-year cycles. The global economic cost of urban flooding exceeded $82 billion in 2023 — making passive drainage systems fiscally indefensible, not just ecologically irresponsible. Sponge city design unifies permeable surfaces, bioswales, urban wetlands, underground cisterns, green roofs, and kinetic water harvesting into one hydrological network. Political resistance, property value anxieties, and fragmented municipal governance remain the primary barriers — not technology or engineering knowledge. By 2030, cities that invest in layered sponge infrastructure now will hold measurable advantages in livability indices, insurance premiums, and climate resilience rankings. |
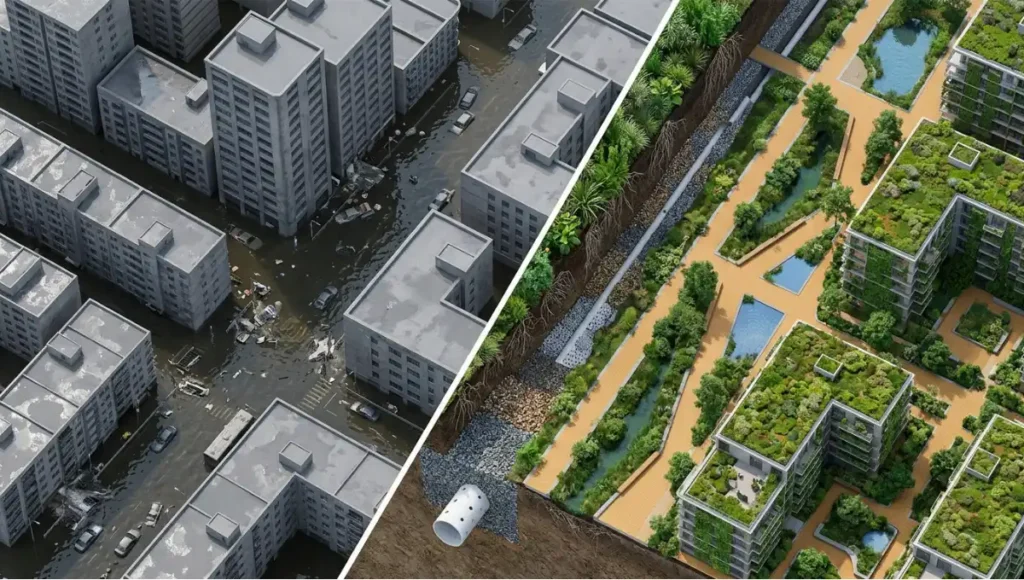
The sponge city infrastructure guide you are reading was not written in response to a single flood event. It was written in response to a century of bad decisions — of pouring concrete over watersheds, of routing rivers underground, of building cities as if water were an inconvenience rather than the organizing logic of all human settlement. You are living in the consequence of that ideology now, and the question is no longer whether your city needs to change. The question is whether it will change fast enough.
Urban flooding is not a weather problem. It is a design problem. And in 2026, with climate volatility accelerating beyond the projections of even pessimistic models, the sponge city infrastructure framework has moved from fringe urban theory to institutional policy — not because governments have become enlightened, but because the insurance sector, the real estate market, and the infrastructure bond market have all begun pricing in flood exposure with alarming precision. The financial reckoning arrived before the political will. That is the reality you are operating within.
The City Is Not a Machine. It Is a Living Membrane.
At Nuvira Space, we do not treat infrastructure as a background condition of urban life. We treat it as the primary sociological text of a civilization — the most honest record of what a society actually values, as opposed to what it claims to. When a city buries its rivers, it is not managing water. It is expressing contempt for natural systems. When a city invests in sponge infrastructure, it is doing something far more radical than flood prevention: it is acknowledging that the urban fabric and the hydrological cycle are one continuous system, and that the hubris of separation has cost us more than we can quantify.
Our approach to sponge city design is rooted in the conviction that resilience is not an amenity — it is the foundational precondition for everything else a city aspires to be. The metropolitan fabric must be recalibrated not at the building scale, not at the block scale, but at the watershed scale. That is where the decisions that matter are made. That is where Nuvira Space operates.
The Blueprint: Sponge City Infrastructure Across 6 Urban Water Types
To deploy sponge city infrastructure intelligently, you must first understand that “urban water” is not a monolithic category. It is a spectrum of six distinct hydrological phenomena, each requiring a specific set of engineered responses. Treating them as interchangeable is what produces the half-measures that fail during actual storm events.
Below is the operational framework — a design specification guide for the six water types your city is already managing, whether it knows it or not.
| Type | Name | Design Challenge |
|---|---|---|
| 01 | Stormwater Runoff | Precipitation that cannot infiltrate impermeable surfaces. Primary driver of acute urban flooding — the first target of any sponge framework. |
| 02 | Groundwater Intrusion | Subsurface water migrating into basements, tunnels, and foundations. Often invisible until catastrophic. Requires passive aquifer management and permeable recharge zones. |
| 03 | Combined Sewer Overflow | The toxic byproduct of cities that merged stormwater and sewage into a single pipe. During heavy rain, that pipe overflows — into rivers, bays, and streets. |
| 04 | Tidal and Riverine Inundation | Coastal and riparian flooding driven by sea-level rise, storm surge, or upstream saturation. Requires hard and soft infrastructure working in concert. |
| 05 | Urban Heat Island Condensation | Microclimate moisture cycles generated by heat-absorbing surfaces, creating localized precipitation intensification — routinely underestimated by standard hydrology models. |
| 06 | Greywater and Reclaimed Water | The underutilized resource stream. Integrated sponge systems can offset 30–40% of non-potable urban water demand through treated greywater and rainwater harvesting. |
The 7-Layer Sponge Infrastructure Stack
Once you understand the six water types, you can map the intervention stack. The following specifications represent the current state of deployed sponge infrastructure across leading global cities. These are not aspirational — they are operational.
Layer 1 — Permeable Surface Systems
Permeable asphalt and concrete pavements achieve infiltration rates of 100 to 3,000 mm per hour, depending on aggregate size and void ratio. Interlocking permeable pavers suit low-speed traffic zones, pedestrian plazas, and parking structures. Gravel infiltration trenches, lined with geotextile membrane at depths of 0.5 to 2.0 m, handle sub-surface drainage. These systems apply to streets, plazas, school yards, and commercial loading docks, and require high-pressure flushing every 12 to 18 months to maintain infiltration capacity.
Layer 2 — Bioswales and Constructed Wetlands
Linear bioswales — vegetated channels with 2 to 6% side slopes — handle 10-year storm events at 50 to 150 L/s per 100 m run. Constructed wetlands at 0.3 to 1.2 m depth use cattail, bulrush, and sedge for biological filtration, achieving 40 to 60% nitrogen removal and 50 to 80% phosphorus retention. Effective stormwater treatment requires these systems to cover 1 to 3% of total catchment area.
Layer 3 — Green Roofs and Living Walls
Extensive green roofs at 60 to 150 mm substrate retain 40 to 60% of rainfall in temperate climates. Intensive systems at 200 to 600 mm retain 70 to 90% and support shrubs and small trees. Both reduce urban heat island effect by 2 to 4°C across the treatment zone. Living wall systems integrated with greywater irrigation cut building cooling loads by 12 to 25%, while structural loads of 80 to 250 kg/m² require early coordination with the structural engineer.
Layer 4 — Underground Cisterns and Detention Basins
Modular plastic crate systems with 90 to 95% void ratio stack to 4 m depth and suit roadway installation. Reinforced concrete detention tanks scale from 500 m³ for a single block to 500,000 m³ for district-level applications. During a 100-year storm event, these systems reduce downstream pipe loading by 30 to 70%. Costs typically run $200 to $600 per m³ of storage capacity, varying with geology and access constraints.
Layer 5 — Riparian Restoration Corridors
River daylighting — the re-exposure of culverted urban streams — restores natural floodplain function and increases in-channel flow capacity by 30 to 150% without hard engineering. Riparian buffers require a minimum width of 15 to 50 m on each bank. Ecological co-benefits are measurable: macroinvertebrate diversity and riparian bird species both increase within two to three seasons of restoration completion.
Layer 6 — Smart Sensor Networks and Predictive Drainage
IoT water level sensors deployed at 50 to 200 m intervals provide real-time flow monitoring across the drainage network. AI-driven predictive valve control enables pre-emptive detention basin drawdown up to 72 hours before storm events, using 15-minute weather radar forecast windows. Integration with digital twin platforms enables building-scale water balancing and continuous regulatory compliance output: discharge, turbidity, pH, and nutrient load data in real time.
Layer 7 — Kinetic Water Features and Public Infrastructure
Dual-function water plazas — public amenity spaces that convert to retention basins during storm events — were pioneered by Rotterdam and are now deployed across Copenhagen, Melbourne, and Singapore. Permeable urban parks with sub-surface drainage galleries provide 2,000 to 20,000 m³ of temporary storm storage in civic green space. Their integration with car-free district design maximizes surface permeability and bioswale continuity across the block.
| KEY PERFORMANCE FIGURES $82 billion — Global urban flood losses, 2023 70% — Peak runoff reduction in mature sponge districts 30–40% — Non-potable water demand offset via greywater integration |
Feasibility Study: Economic and Political Barriers
The engineering knowledge exists. The case studies exist. The financial models demonstrating positive return on investment over 20-year cycles exist. And yet, most cities are still widening drains and pouring concrete. Understanding why requires a frank analysis of the institutional dynamics that consistently override technical rationality in urban governance.
Economic Barriers
The primary economic obstacle is not cost — it is the structure of cost accounting. Sponge infrastructure requires high upfront capital expenditure with benefits that are diffuse, long-term, and partially non-monetizable. Municipal budget cycles rarely extend beyond four years. The politician who approves a $200 million bioswale network will not be in office when it prevents $800 million in flood damage a decade later. This temporal misalignment between investment and benefit is the single most persistent structural dysfunction in urban resilience planning.
Construction industry lobbying compounds the problem. Conventional grey infrastructure — pipes, pumps, and concrete channels — is delivered by well-organized industry coalitions with established procurement relationships. Sponge infrastructure requires interdisciplinary contracts spanning landscape ecology, civil engineering, urban hydrology, and community engagement. Procurement frameworks in most cities are not designed for this complexity.
Political Barriers. Sponge City Infrastructure Guide
Property value anxiety is the most politically potent barrier. Residents adjacent to proposed wetland restoration or bioswale corridors consistently raise concerns about mosquitoes, drainage, and neighborhood character. These concerns are technically unfounded when proper engineering is applied — but they are politically real. And elected officials, facing short electoral cycles, consistently defer to vocal property-owner constituencies over long-range planning rationality.
“The city that waits for political consensus before deploying flood resilience infrastructure is the city that floods.”
Jurisdictional fragmentation makes this worse. A single watershed in a metropolitan region may cross dozens of municipal boundaries, each with its own stormwater utility, planning department, and political priorities. The hydrological system does not recognize administrative lines. Flood water does not stop at the city limit. Yet the governance structures that must respond to it are structurally incapable of acting at the watershed scale without extraordinary political coordination.
The most successful sponge city programmes — in Rotterdam, Singapore, and Copenhagen — succeeded not because their politics were easier, but because they established single-authority institutions with cross-jurisdictional mandates and long-term capital commitments insulated from electoral cycles. That is the institutional design lesson. The technology is not the hard part.
Proof of Concept: Singapore
REAL-WORLD IMPLEMENTATION · ABC WATERS PROGRAMME
Singapore: The Global Benchmark for Integrated Urban Water Management
Singapore’s Active, Beautiful, Clean Waters (ABC Waters) programme, launched in 2006 and expanded continuously since, represents the most systematically documented sponge city implementation in the world. Over the programme’s first decade, Singapore transformed more than 100 km of concrete drainage channels into naturalized waterways, integrated 1,500+ hectares of new green spaces into its water management network, and reduced peak stormwater discharge in treated catchments by an average of 35 to 50%.
By 2025, Singapore’s Public Utilities Board (PUB) had embedded ABC Waters design standards into the building code for all new developments above 0.2 hectares — effectively mandating sponge design at scale. The programme’s governance model is what makes the technical ambition executable: a single statutory authority with combined water supply, drainage, and sewerage mandate, operating under a long-term national water plan that spans 50 years. The American Institute of Architects (AIA) has cited Singapore’s integration of stormwater management with urban design as a reference case for sustainable district planning in its publicly available practice resources.
SPECULATIVE / INTERNAL CONCEPT STUDY BY NUVIRA SPACE
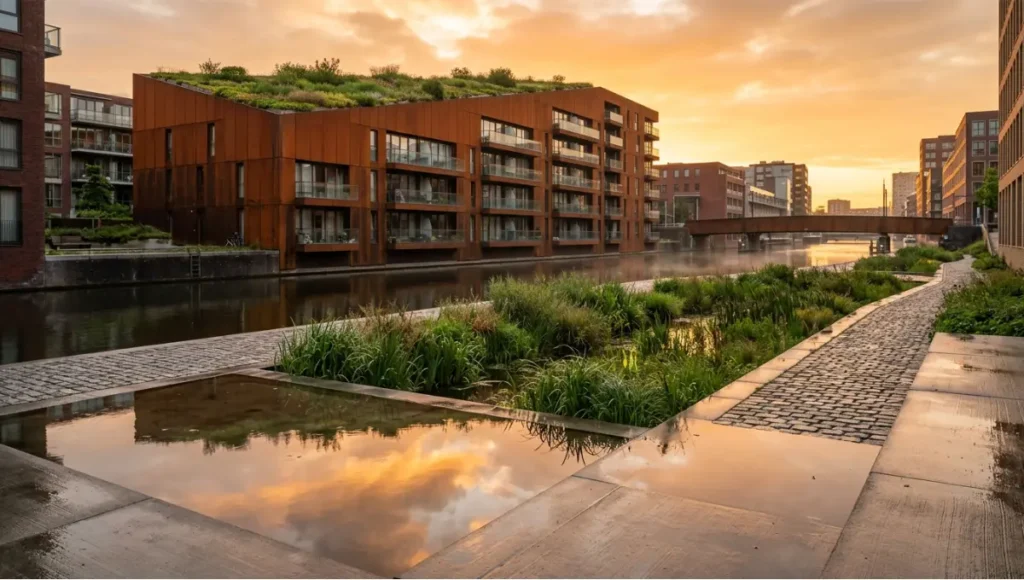
Project Hydralis — Rotterdam Waterfront Extension
Project Overview
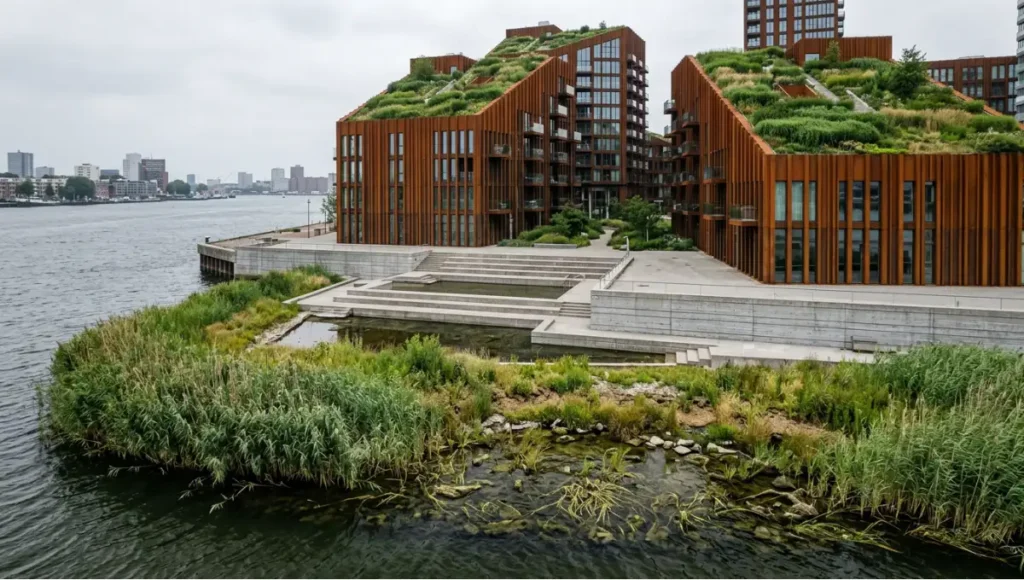
Location: South Rotterdam Waterfront, Netherlands — a 4.2-hectare post-industrial brownfield site at the confluence of the Nieuwe Maas river and the Rijnhaven basin.
Typology: Mixed-use resilient district and sponge infrastructure testbed.
Vision: Project Hydralis imagines a district where hydrological infrastructure is the architecture — where sponge systems are not hidden beneath the streets but expressed as the organizing spatial logic of the entire neighborhood. Every public space doubles as water infrastructure. Every building contributes to the water budget of the block. The district floods gracefully, on its own terms, and recovers within hours rather than days.
Design Levers Applied
Water Plaza Network
Three tiered water plazas total 8,400 m² of dual-function civic and retention space, with a combined temporary storage capacity of 14,200 m³ — sufficient to manage a 1-in-100-year storm event without downstream pipe surcharge. Constructed from textured exposed concrete with integrated seating and bioswale planting at plaza margins, all plazas are gravity-fed via a 0.8 to 1.2% gradient streetscape. No pump infrastructure is required under normal operating conditions.
Green Roof Hydrological Spine Intensive green roofs on all residential and commercial buildings — mandatory 60% coverage — total 3.8 hectares of installed green roof area. Greywater collection from all rooftop systems yields an estimated 1.2 million litres per year of non-potable water, recirculated for irrigation and toilet flushing, and integrated with smart building automation systems for real-time water balancing at building level.
Tidal Wetland Buffer Zone A 620 m reconstructed intertidal wetland replaces the existing 2.1 m concrete flood walls along the Nieuwe Maas frontage. Its substrate — engineered clay-peat mix at 400 to 800 mm depth — is planted with native reed and sedge communities. Modeled storm surge attenuation at shoreline is 0.4 to 0.7 m wave height reduction. Carbon sequestration is estimated at 18 to 28 tCO2 per hectare per year — a direct contribution to Rotterdam’s 2030 climate targets.
Transferable Takeaway
Project Hydralis is designed as a replicable module. The 4.2-hectare district unit — with its water plaza network, mandatory green roof spine, and tidal buffer edge — can be adapted to comparable post-industrial waterfront sites in Hamburg, Baltimore, Glasgow, or Osaka. The underlying principle is transferable without modification: flood resilience and urban quality are not in tension. They are, when properly integrated, the same design objective.
2030 Future Projection: The Divergence Between Sponge Cities and Grey Cities
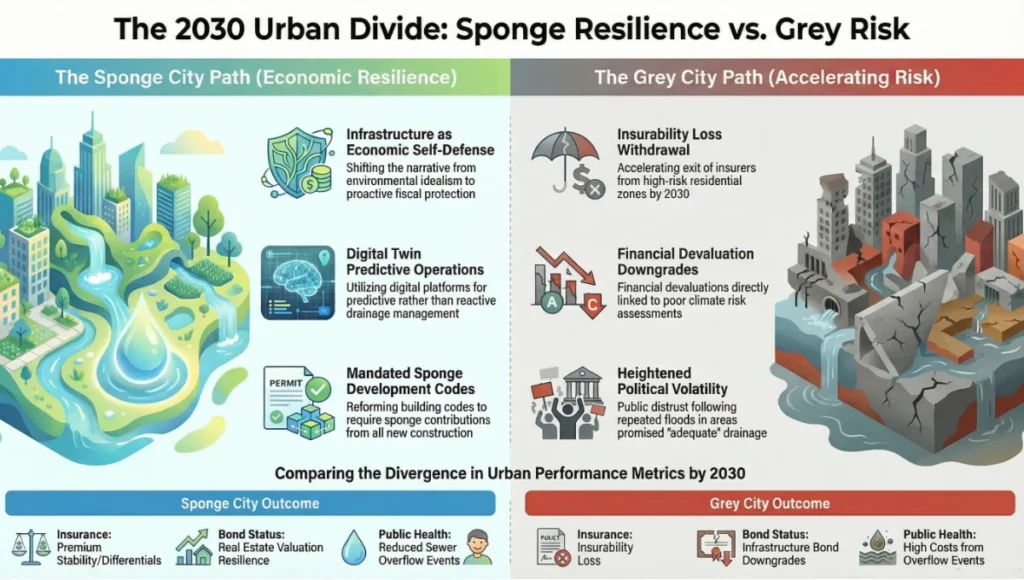
The data trajectory is not ambiguous. By 2030, the gap between cities that have committed to sponge infrastructure programmes and those that have not will be measurable across at least four major urban performance metrics: insurance premium differentials, real estate valuation resilience under climate risk disclosure mandates, public health costs related to combined sewer overflow events, and infrastructure lifecycle expenditure per capita.
The cities on the right side of that divergence share several characteristics. They will have established cross-jurisdictional stormwater authorities with long-term capital mandates. They will have reformed development codes to require sponge design contributions from all major new construction. They will have invested in digital twin platforms for predictive rather than reactive drainage operations. And they will have built the political narrative — successfully — that sponge infrastructure is not environmental idealism but economic self-defense.
The cities on the wrong side face a different future: accelerating insurance market withdrawal from high-risk residential zones, infrastructure bond downgrades linked to climate risk assessments, and the political volatility that accompanies repeated catastrophic flood events in communities that were told the drainage system was adequate.
You have approximately 36 months to determine which side your city is on. The window for cost-effective intervention is narrowing faster than most municipal planning cycles can process. The question is not whether to build sponge infrastructure. The question is whether you build it now, on your terms, or whether the market forces that decision upon you under far less favorable conditions.
Comprehensive Technical FAQ
Q: How does sponge city infrastructure differ from conventional stormwater management?
Conventional stormwater management is predicated on rapid conveyance — getting water out of the city as fast as possible through pipes and channels. Sponge infrastructure inverts this logic: it slows water down, retains it, infiltrates it, and uses it. The target is not discharge velocity but retention time and volume. This requires a fundamentally different spatial logic — distributed rather than centralized, surface-visible rather than buried, ecologically active rather than hydraulically passive. Conventional pipe systems are designed for 5 to 25-year storm events; mature sponge systems are typically designed for 50 to 100-year events. The optimal approach integrates sponge elements with retained pipe capacity rather than replacing grey infrastructure entirely.
Q: What is the minimum catchment size for sponge infrastructure to be cost-effective?
There is no absolute minimum — individual buildings can implement meaningful sponge elements such as green roofs, rainwater harvesting, and permeable parking. However, the cost-benefit curve becomes most favorable at the district scale: 5 to 50 hectares of contiguous catchment area, where interaction between individual sponge elements creates network effects that multiply each component’s performance. Below 1 hectare, isolated sponge elements function as stormwater mitigation, not systemic resilience.
Q: How do sponge cities perform in cold climates where the ground freezes seasonally?
Cold climate performance requires design adaptation but is not a disqualifying constraint. Copenhagen — operating in a climate with regular ground frost — has deployed extensive sponge infrastructure with several key adaptations. Bioswale planting species are selected for freeze-thaw tolerance, favoring native sedges, willows, and alders. Permeable pavement base courses are increased to 450 to 600 mm to prevent frost heave. Underground cistern systems are unaffected by surface frost and operate year-round. Spring snowmelt adds 15 to 25% to design storm volume in northern latitude applications and must be accounted for in detention basin sizing.
Q: Can sponge infrastructure be retrofitted into existing dense urban areas?
Retrofit is both possible and the dominant implementation context globally, since most of the world’s flood-exposed cities are already built. Retrofit is more expensive and more politically complex than new development integration, but the most cost-effective retrofit sequence is well established: road reconstruction projects (install permeable pavement as a co-benefit), park redevelopment (add detention galleries under new play areas), and building permit renewal cycles (mandate green roof installation at major refurbishments). Over a 15 to 20-year reform programme, this approach can transform the hydrological performance of an existing district without wholesale reconstruction.
Q: How are sponge city projects financed in practice?
The financing landscape has matured significantly since 2020. Green bonds tied to water resilience outcomes have proven viable at municipal and sovereign scale — Rotterdam’s 2019 green bond raised €600 million with partial sponge infrastructure allocation. Stormwater utility fees levied per parcel based on impervious surface area, with credits for on-site sponge infrastructure, are operational in Philadelphia, Washington D.C., and Hamburg. Development levies requiring sponge contributions are mandatory in Singapore for all projects above 0.2 hectares. Emerging insurance industry co-investment structures, where flood insurers co-fund upstream sponge infrastructure in exchange for reduced claims liability, represent the most promising new financing frontier for the decade ahead.
| Your City’s Water Future Is Being Decided Now The infrastructure investments made in the next 36 months will define your city’s flood exposure for the next 50 years. The technical framework exists. The case studies are documented. The financing mechanisms are operational. What remains is the decision to act — and the design intelligence to act well. |
© Nuvira Space. All rights reserved. | URBAN PULSE Series. All specifications cited are based on published technical guidance from the Singapore Public Utilities Board (PUB) ABC Waters Design Guidelines, Rotterdam Climate Proof Programme documentation, Copenhagen Cloudburst Management Plan 2012–2026, and peer-reviewed research in Urban Water and Landscape and Urban Planning journals. AIA sustainable design references are drawn from publicly available AIA practice resources on resilient design.
Project Hydralis — Rotterdam Waterfront Extension is a speculative internal concept study and does not represent a completed project.